
TSTUSDC Spikes, Then Gets Blocked at Resistance
 Aime Summary
Summary
- TSTUSDC trades in a tight range near 0.01139 after significant volatility.
- Volume spikes indicate sharp intraday rejections at key resistance levels.
- Market structure remains range-bound with no clear directional bias.
- Recent price action suggests indecision between immediate support and resistance.
- Traders should monitor volume for confirmation of any potential breakout.
Market Overview
TSTUSDC closed at 0.01139 USDC with a 24-hour total volume of approximately 12.4 million USDC. The asset exhibited high volatility with multiple intraday swings, reflecting active but contested trading levels.
1-Hour Support/Resistance and Candlestick Patterns
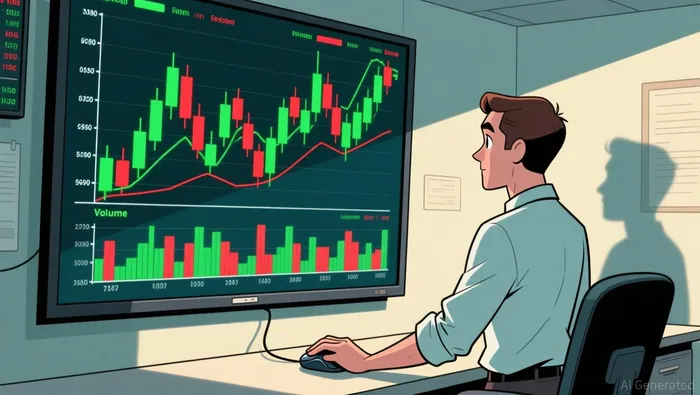
Price action reveals a defined trading range with clear rejection zones. The level at 0.01255 acted as strong resistance, evidenced by the candle at 2026-08-01 03:00 which formed a long upper shadow, indicating sellers stepped in aggressively after the price touched 0.01341. This rejection was confirmed by subsequent bearish engulfing patterns, such as the one observed at 2026-08-01 00:00 and 2026-08-01 11:00, where the closing price fell below the opening price of the prior candle, covering its body fully. On the downside, support appears to be testing the 0.01137 area, as seen in the final hour of the data where the low reached 0.01137. The presence of a long lower shadow at 2026-08-01 05:00 suggests some buying interest near 0.01164, but the price failed to sustain momentum. The current price of 0.01139 is closer to the recent support zone than the immediate resistance at 0.01255, suggesting a slight bearish bias within the consolidation phase.
Volume and Turnover vs. Historical Comparison
The 24-hour total volume of roughly 12.4 million USDC is significantly lower than the 7-day average daily volume of 8.77 million USDC, indicating a potential slowdown in overall market participation despite intraday spikes. However, specific hours showed extreme volume activity. The hour ending at 2026-08-01 03:00 recorded a volume of 3.38 million USDC, which is substantially higher than the 7-day average single-hour volume of approximately 365,617 USDC. This spike coincided with a price increase to 0.01341 followed by a sharp rejection, suggesting that the high volume was driven by selling pressure rather than sustained buying. Another notable spike occurred at 2026-08-01 02:00 with 1.07 million USDC, preceding the move to 0.01274. The pattern of high volume followed by price reversals, particularly the bearish engulfing candles after the 03:00 spike, suggests that volume anomalies did not drive sustained price trends but rather facilitated profit-taking or stop-loss executions. The lack of follow-through in subsequent hours indicates that the volume spikes were not indicative of a strong directional breakout.
Look Back: Current Market Phase
The market structure for TSTUSDCTST-- over the past 7 to 15 days is best described as range-bound. The price has oscillated between key support levels around 0.01107 and resistance levels near 0.01264 without establishing a clear sequence of higher highs or lower lows. The recent 7-day price change of -3.80% and 3-day change of +2.34% further support the view of a consolidating market rather than a trending one. The absence of a sustained breakout above resistance or breakdown below support, combined with the repeated rejection candles, suggests that the market is in a phase of mean reversion or consolidation. Traders should expect continued volatility within this range until a decisive volume-backed breakout occurs. For the next 24 hours, the price may continue to test the lower end of the range near 0.01137. A break below this level could expose downside risk toward 0.01107, while a rejection of this support might lead to a retest of the 0.01180 resistance level.

Decoding market patterns and unlocking profitable trading strategies in the crypto space
Latest Articles
Stay ahead of the market.
Get curated U.S. market news, insights and key dates delivered to your inbox.


AInvest
PRO
AInvest
PRO




Comments
No comments yet