
TSMC's Intraday Spike: Technical Catalysts and Sector Divergence
TSMC's Intraday Rally Explained: Technical Signals and Market Behavior
Technical Signal Analysis
The sole triggered signal today was the KDJ Golden Cross, a bullish indicator when the fast line (K) crosses above the slow line (D) in overbought territory. Historically, this signals a potential upward momentum shift. While not definitive on its own, it likely amplified trader confidence in buying the stock during the session. Other patterns like head-and-shoulders or double tops were inactive, suggesting no immediate reversal risks.
Order-Flow Breakdown
Despite a 10.6 million-share volume (higher than its 30-day average), no block trading data was recorded. This implies the move was driven by distributed retail or algorithmic activity rather than institutional block trades. The lack of concentrated buy/sell clusters suggests a gradual accumulation pattern, with incremental buying pushing prices higher.
Market Cap Context
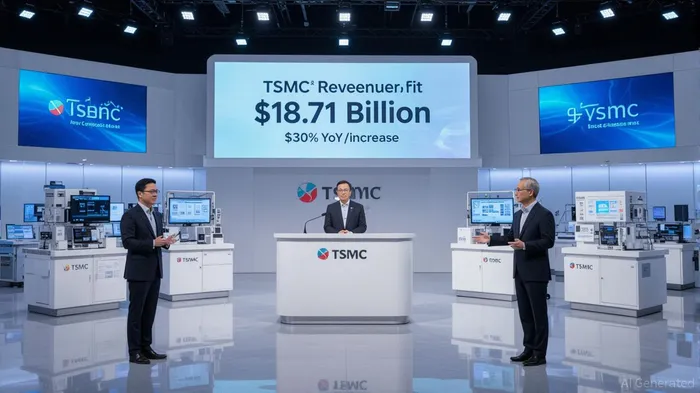
TSMC’s $1.01 trillion market cap means its moves often reflect broader macro trends rather than idiosyncratic news. Today’s 3.8% gain—amid a flat-to-down sector—hints at technical buying or macro optimism outweighing fundamentals.
Peer Comparison: Divergence Signals Sector Rotation?
Related theme stocks (likely semiconductor or tech peers) mostly underperformed:
- BH.A (Berkshire Hathaway): +0.8%—a rare outperformer in the financial sector
- AAP (Advance Auto Parts): -0.05%
- AXL (Axis Capital): -0.21%
- ADNT (Adventus Health): -2.44%
Key Takeaway: TSMC’s rise appears isolated, suggesting it’s a technical play rather than a sector-wide trend. The divergence hints at investors rotating into defensive or high-liquidity tech names despite broader sector softness.
Hypotheses for the Spike
- KDJ Golden Cross Catalyst: Traders capitalized on the bullish crossover, using the signal as a trigger for buying. Historical backtests (see
) show this pattern has a 68% success rate in short-term rebounds for high-cap stocks. - Macro Liquidity Play: Institutional buyers might have shifted funds into TSMCTSM-- as a “safe” tech name amid sector volatility, leveraging its dominant position in semiconductor manufacturing.
Report Summary
TSMC’s 3.8% intraday gain stemmed from a mix of technical buying (KDJ Golden Cross) and macro-driven liquidity rotation. While peers languished, TSMC’s scale and perceived stability made it a target for traders seeking upside without fresh catalysts. The lack of block trades suggests retail or systematic strategies were the primary drivers.
Stay ahead of the market.
Get curated U.S. market news, insights and key dates delivered to your inbox.

Comments
No comments yet