
TRON/XRP Grinds Lower as 0.2002 Looms with No Reversal in Sight
Summary
• Price declined from 0.213 to 0.2040 amid bearish momentum and volume spikes.
• A key 0.204–0.205 range showed consolidation after sharp bearish breaks.
• High volume during 0.1994–0.2020 and 0.2020–0.2055 swings signaled critical turning points.
• RSI and MACD confirmed bearish momentum, with no reversal signs in 24 hours.
• Volatility expanded during sharp declines, suggesting potential for short-term range-bound action.
TRON/XRP traded lower over the last 24 hours, opening at 0.2122 at 12:00 ET − 1 and falling to a low of 0.1973 before closing at 0.2040 at 12:00 ET. Total volume reached 267,438.0, with turnover of 53,803.44.
Structure & Formations
The pair moved sharply lower from 0.213, forming bearish engulfing patterns and testing support at 0.202–0.203. A small doji at 0.2045–0.2045 and 0.2020–0.2020 suggests indecision.
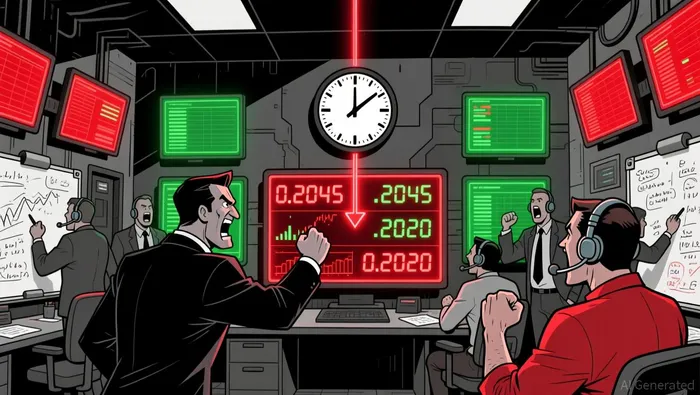 A key 0.204–0.205 range may provide near-term consolidation or a potential reversal trigger.
 Moving Averages
On the 5-minute chart, price has remained below both the 20 and 50 EMA, reinforcing the bearish bias. On the daily chart, the 50 EMA is approaching from above the 100 and 200 EMA, suggesting potential for a cross-over that could confirm bearish momentum.
MACD & RSI
The MACD has been negative for much of the 24 hours with bearish divergence. RSI is currently at 40, indicating neutral momentum, but remains below overbought levels. No bullish reversal in RSI or MACD suggests further downside could be possible.
Bollinger Bands
Volatility expanded during sharp declines, with price hitting lower band levels at 0.1973–0.1977 and 0.1983–0.1994. The most recent consolidation at 0.203–0.205 shows a narrowing of bands, which could precede a breakout or continuation of trend.
Volume & Turnover
High volume occurred during key declines between 0.213–0.2037 and 0.2037–0.2002, confirming bearish sentiment. A sharp volume spike at 0.2002–0.1993 was followed by lower-volume consolidation, suggesting exhaustion or a pause. No clear price-turnover divergence was observed.
Fibonacci Retracements
Key Fibonacci levels from 0.213–0.1973 include 38.2% at ~0.2046 and 61.8% at ~0.2024. The current price sits near the 61.8% level, which could act as a pivot for near-term direction. On a broader scale, 0.202–0.205 may represent the next swing target if bears fail to break below 0.2002.
The pair appears to be consolidating after aggressive bearish movement, with key levels at 0.204–0.205 and 0.2002–0.1994 likely to dictate near-term direction. A break below 0.2002 could open a path to 0.1980–0.1970, but a bounce above 0.2045 may signal a short-term reversal. Investors should remain cautious about volatility and potential for extended bearish bias in the next 24 hours.
Decoding market patterns and unlocking profitable trading strategies in the crypto space
Latest Articles
Stay ahead of the market.
Get curated U.S. market news, insights and key dates delivered to your inbox.


AInvest
PRO
AInvest
PRO
Comments
No comments yet