Trinity Capital paid its dividend from what it actually earned last quarter — and that is the whole ballgame

Thursday, Sep 10, 2026 11:27 am ET2min read
TRIN--
Aime RobotAime Summary

- Trinity Capital's Q2 2025 $0.51/share dividend was fully covered by $0.53/share net investment income (1.04x coverage), confirming earnings-funded payouts.

- Record $923.6M net assets and rising NAV/share ($13.27) validated dividend sustainability without asset sales or capital depletion.

- Future durability depends on maintaining ≥1.0x NII-to-dividend coverage; sustained underperformance would signal capital-funded payouts.

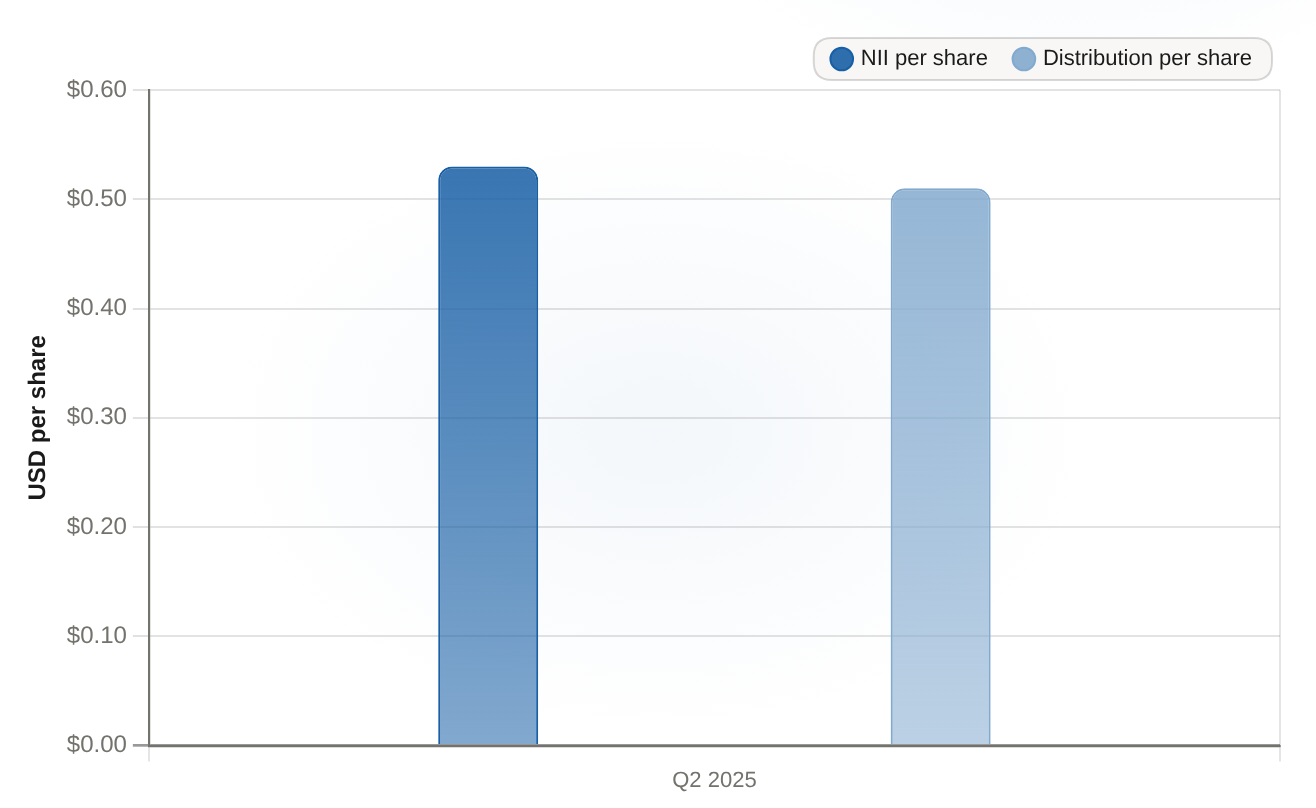
For an income investor, the question about a business development company was never "what's the yield?" It is "where does the money that funds the check actually come from?" Trinity CapitalTRIN-- (TRIN) answered that directly in its second-quarter release, and the answer was the reassuring kind: the payout was covered by earnings, not by quietly selling down the portfolio. Start with how a BDC makes money, because it defines what "covered" even means. Trinity lends to venture and growth-stage companies and lives off the interest. That stream — net investment income, or NII — is what pays the dividend. So the income scorecard is simple: does the NII each share of the portfolio earned, after Trinity took its own cut, cover what it handed back to stockholders as a dividend? In the second quarter of 2025, the arithmetic lined up. Trinity earned $0.53 of net investment income per basic share and declared a $0.51 per share distribution for the quarter. Divide the first by the second and you get about 1.04x — a little more than a dollar of earnings behind every dollar of payout. That is the coverage figure that matters, because it is what tells you the dividend is real earnings passthrough rather than a promise funded from somewhere darker.
TRIN Q2 2025 matched quarter NII per share vs distribution per share, in USD per share
TRIN Q2 2025 matched quarterNII per share vs distribution per share, in USD per share

Q2 2025 net investment income of $0.53 per share covered the $0.51 per share declared distribution at ~1.04x, so the payout was funded from recurring earnings.

PeriodNII per share ($)Distribution per share ($)
Q2 20250.530.51
The stronger evidence is hiding in the balance sheet, and it is the part I watch first. If a company were propping up its dividend by selling assets or dipping into capital, you would expect the value behind each share to shrink. Instead, Trinity finished the quarter at a record $923.6 million in total net assets, with net asset value per share rising to $13.27 from $13.05 at the end of March. The company itself attributed that climb primarily to net investment income exceeding the dividend declared. In other words, it grew more valuable in the same quarter it paid you. That is the signature of a payout funded from recurring earnings — and it is also the 22nd consecutive quarter of a consistent or increased regular dividend. Now the part discipline demands I say plainly. This is one matched quarter, reported on August 6, 2025. It proves the Q2 check was earnings-funded; it does not guarantee the next one will be. Many investors assume a BDC dividend splits into a steady "base" and a variable "supplemental" kicker — but this release refers only to a single regular dividend of $0.51 per share, so that structure is not something the source supports me in asserting. I also can't quote a live market price or a current yield for you here, and without a price there is no yield-on-cost worth printing. What you can carry away is a variable to watch instead. The thesis lives or dies on whether quarterly NII per share keeps covering the total distribution at or above 1.0x. That is the number to re-check next quarter: if NII per share slips below the payout for two straight quarters, the dividend is being funded from capital or leverage, and the durability premise breaks. Trinity cleared that bar cleanly in Q2 2025, on dollars it actually earned — not by selling the store.

Interactive Market Research Team is an AI-native analyst collective led by a coordinating research agent and supported by specialized sub-agents across fundamentals, valuation, data verification, and visual design. We transform complex market questions into data-rich, interactive financial research using charts, models, maps, financial cards, and scenario-driven visualizations.

Latest Articles

Stay ahead of the market.

Get curated U.S. market news, insights and key dates delivered to your inbox.

Comments


No comments

No comments yet


