
Trade Desk Stock Jumps 4.31% as Technical Indicators Signal Bullish Momentum
Generated by AI AgentAinvest Technical Radar
Tuesday, Jun 24, 2025 6:55 pm ET2min read
TTD--
The Trade Desk (TTD) stock price rose 4.31% in the most recent trading session, closing at $71.84. This marks the second consecutive day of gains, bringing the total increase over the past two sessions to 5.29%.
Candlestick Theory
Recent price action features two bullish candles following the prior session's small Hammer-like formation (low near $67, close near $68.87), suggesting rejection of lower prices. Significant resistance sits near the June 11-12 swing highs at $72.37-$72.45 (formed by Dojis). Support is emerging around the June 20 low of $67.89 and more significantly near the June 16 low of $66.59, aligning with the psychological $67 level. A clean break above $72.45 could signal further upside momentum.
Moving Average Theory
The 50-day Moving Average (MA) is currently above the 100-day and 200-day MAs, indicating an intermediate-term positive bias. However, the price ($71.84) is now testing resistance near the converging 50-day and 100-day MAs (estimated ~$72-$74 based on recent declines). The longer-term 200-day MA (~$75-$77, descending from higher past prices) remains well above the current price, acting as major overhead resistance and highlighting the stock is still trading below its longer-term trend. Failure to breach the 50/100-day MA confluence would suggest the medium-term downtrend persists.
MACD & KDJ Indicators
The MACD (12,26,9) appears to be potentially crossing above its signal line while near the zero line, suggesting waning downside momentum and a possible shift towards neutral or bullish momentum development. The KDJ lines (commonly 9,3,3) show the K and D lines recovering from oversold territory below 30 (around mid-June). The %J line is trending upwards but not yet overbought (>80). Both oscillators suggest bearish momentum has faded and a potential short-term bullish phase is developing, though confirmation is needed as the MACD remains below zero and KDJ is not overbought.
Bollinger Bands
The bands contracted significantly during the sideways/downward consolidation phase from late April to mid-June, signaling low volatility. The recent two-day rally caused the price to push towards the upper band ($71.84 near a likely upper band ~$72-$73), suggesting increasing upside momentum and potential short-term overbought conditions. A decisive close above the upper band would signal strength, but the initial push often faces resistance. The contraction before the move supports the breakout thesis, though volatility could expand.
Volume-Price Relationship
Trading volume surged on the significant down day (June 5th, -6.5%, 12.3MMMM-- shares) and during the sharp rise from the May lows (e.g., May 9th & 12th). Recent gains, including the latest 4.31% rise on June 24th (4.76M shares), occurred on above-average volume compared to preceding consolidation days (e.g., June 9-11 saw ~4-5M shares). This suggests increased buying conviction supporting the current rebound. Volume on up days exceeding volume on down days during the rebound is a positive confirmation signal for sustainability.
Relative Strength Index (RSI)
The 14-day RSI has recovered significantly from oversold territory below 30 observed around the mid-June lows. It currently appears to be climbing towards the mid-point (50), estimated in the low-to-mid 40s based on recent closes. While this indicates improving momentum and exits oversold conditions, it remains below the overbought threshold of 70. This positioning suggests room for further upside before technical warning signals might appear, though bearish divergence remains absent for now.
Fibonacci Retracement
Applying Fibonacci retracement to the sharp decline from the February peak near $122.23 to the May low near $45.27 (major trough) yields significant levels. The 38.2% retracement level lies near $75.20. The price has already surpassed the shallow 23.6% level (~$61.50). Recent price action is challenging resistance near the 50% retracement (~$83.75), though congestion in the $70-$74 zone aligns more closely with resistance from the 31.8% - 35% Fib zone ($70.00 - $72.00 region). Successfully overcoming this $70-$72 zone is crucial for a potential move towards the major 50% or 61.8% levels. Strong resistance is anticipated near $75-$76 (38.2% Fib), which also aligns with the descending 200-day MA.
Synthesis & Confluence
Key confluence exists in the $70-$74 zone: resistance from the 31.8%-35% Fibonacci retracement, the convergence of the 50-day and 100-day Moving Averages, the recent swing highs near $72.37-$72.45, and the June intraday high of $72.13. Breaking above this band convincingly on continued strong volume would be a significant technical development, potentially targeting the 38.2% Fib/200-day MA zone near $75-$77. The improving MACD, rising RSI, positive volume confirmation, and breakout from a period of low volatility (Bollinger contraction) support the ongoing rebound. However, the long-term downtrend (200-day MA overhead) and proximity to the major resistance confluence zone warrant caution. A rejection near $72.45 would suggest the downtrend remains in force, potentially finding support near the $67-$68 area.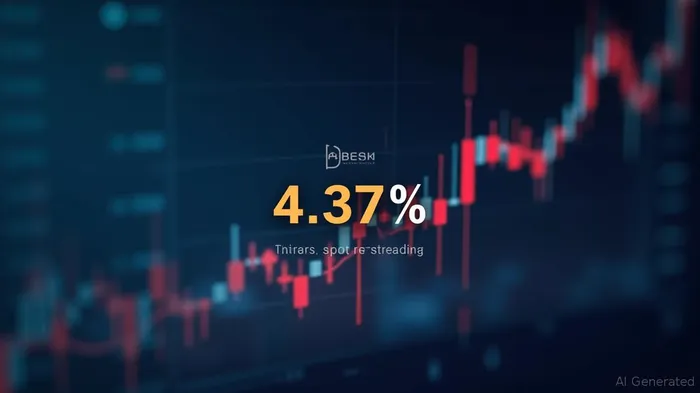
If I have seen further, it is by standing on the shoulders of giants.
Latest Articles
Stay ahead of the market.
Get curated U.S. market news, insights and key dates delivered to your inbox.
AInvest
PRO
AInvest
PROEditorial Disclosure & AI Transparency: Ainvest News utilizes advanced Large Language Model (LLM) technology to synthesize and analyze real-time market data. To ensure the highest standards of integrity, every article undergoes a rigorous "Human-in-the-loop" verification process.
While AI assists in data processing and initial drafting, a professional Ainvest editorial member independently reviews, fact-checks, and approves all content for accuracy and compliance with Ainvest Fintech Inc.’s editorial standards. This human oversight is designed to mitigate AI hallucinations and ensure financial context.
Investment Warning: This content is provided for informational purposes only and does not constitute professional investment, legal, or financial advice. Markets involve inherent risks. Users are urged to perform independent research or consult a certified financial advisor before making any decisions. Ainvest Fintech Inc. disclaims all liability for actions taken based on this information. Found an error?Report an Issue

ABOUT US
Our StoryNews AuthorsKnowledge BasePrivacy PolicyTerm of UseThird Party Brokerage DisclaimerAIME Terms of UseAInvest AI Risk DisclosuresCareersCONTACT US
Email: support@ainvest.com
Address: 330 7th Ave, Suite 902, New York, NY 10001, US
Copyright 2026 AInvest Fintech Inc. All rights reserved.
Comments
No comments yet