
The Trade Desk Stalls Near Key $77.80 Resistance After 0.07% Gain
Generated by AI AgentAinvest Technical Radar
Tuesday, Jul 15, 2025 6:41 pm ET2min read
TTD--
The Trade Desk (TTD) closed at $75.43 on July 14, 2025, posting a marginal gain of 0.07% after trading between $75.30 and $77.77 during the session. This follows recent consolidation near the $75-$77 range, reflecting cautious sentiment after the stock's recovery from April 2025 lows near $45.
Candlestick Theory
Recent candlesticks show indecision, with small-bodied days dominating after the July 10th bullish engulfing pattern (low: $75.61, high: $77.12) failed to sustain momentum. The July 14th session formed a near-doji, suggesting equilibrium between buyers and sellers. Key resistance is emerging near the June swing high of $77.77, aligning with the February 2025 gap-down level. Support rests firmly at $73.75 (July 9th low), reinforced by the May-June trough near $70.
Moving Average Theory
The 50-day moving average (approximated at $72.80) recently crossed above the 100-day (~$71.20), signaling improving medium-term momentum. However, the 200-day SMA (~$78.50) caps upside, and the current price trades below all major long-term averages. This configuration suggests a neutral-bearish bias, with sustained bullish confirmation requiring a close above the 200-day barrier.
MACD & KDJ Indicators
MACD shows a fading bullish crossover as its histogram contracts near zero, indicating dwindling upward momentum. Simultaneously, the KDJ oscillator’s %K line (recently near 65) has retreated from overbought territory (>80) after peaking on July 10th. This divergence suggests weakening buying pressure, though neither indicator yet signals an outright bearish reversal.
Bollinger Bands
Bollinger Bands have contracted 15% over the past two weeks (July 1–14), reflecting declining volatility and impending directional bias. Price currently hugs the middle band (~$75), lacking conviction. A decisive break above the upper band ($77.50) or below the lower band ($72.50) would signal volatility expansion and trend acceleration, with a slight edge to upside potential given the recent consolidation near resistance.
Volume-Price Relationship
Volume peaked during the May 12th surge (+11.77%, 32M shares) and May 9th rally (+18.6%, 49M shares), validating those advances. Recent volume has moderated, averaging 6-8M shares during July’s sideways movement, suggesting limited conviction. The July 11th decline (-1.91%) occurred on below-average volume (5.95M shares), hinting at absent seller conviction. Sustained closes above $77 require volume expansion to confirm demand.
Relative Strength Index (RSI)
The 14-day RSI oscillates near 55, reflecting neutral momentum without overbought (>70) or oversold (<30) extremes. This aligns with recent range-bound action. Notably, RSI has formed lower highs since July 10th while prices tested similar highs, creating a bearish divergence that warns of fading upside strength. The indicator’s current position allows room for either directional shift.
Fibonacci Retracement
Applying Fib levels between the April 2025 low of $44.95 and February 2025 high of $122.46 shows critical retracement thresholds. Recent price action stalled near the 38.2% retracement ($76.80), which converges with the May-June resistance zone. The 50% level ($83.70) aligns with the 200-day SMA, creating a formidable resistance cluster. Downside support converges at the 23.6% Fib level ($70.50), near the June pivot low.
Confluence & Divergence Observations
Confluence appears at $76.80-$77.50, where the 38.2% Fibonacci level, February gap resistance, and Bollinger upper band align, making this a critical breakout target. Conversely, the $70.50-$73.75 zone integrates Fib support, July swing lows, and the 50/100-day SMAs. Divergences include weakening RSI/MACD momentum against stagnant prices and low-volume pullbacks amid a technical uptrend. These suggest consolidation may resolve upward if volume materializes, though bearish momentum divergences advise caution. Overall, The Trade DeskTTD-- requires a decisive move above $77.80 to signal bullish resumption, while failure below $73.75 may trigger retesting of $70.50 support.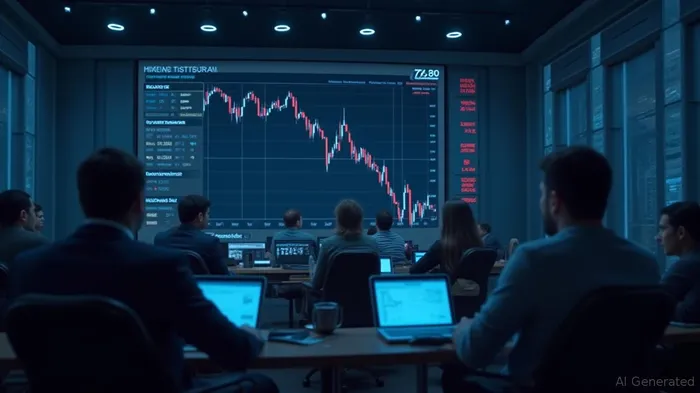
If I have seen further, it is by standing on the shoulders of giants.
Latest Articles
Stay ahead of the market.
Get curated U.S. market news, insights and key dates delivered to your inbox.
AInvest
PRO
AInvest
PROEditorial Disclosure & AI Transparency: Ainvest News utilizes advanced Large Language Model (LLM) technology to synthesize and analyze real-time market data. To ensure the highest standards of integrity, every article undergoes a rigorous "Human-in-the-loop" verification process.
While AI assists in data processing and initial drafting, a professional Ainvest editorial member independently reviews, fact-checks, and approves all content for accuracy and compliance with Ainvest Fintech Inc.’s editorial standards. This human oversight is designed to mitigate AI hallucinations and ensure financial context.
Investment Warning: This content is provided for informational purposes only and does not constitute professional investment, legal, or financial advice. Markets involve inherent risks. Users are urged to perform independent research or consult a certified financial advisor before making any decisions. Ainvest Fintech Inc. disclaims all liability for actions taken based on this information. Found an error?Report an Issue

ABOUT US
Our StoryNews AuthorsKnowledge BasePrivacy PolicyTerm of UseThird Party Brokerage DisclaimerAIME Terms of UseAInvest AI Risk DisclosuresCareersCONTACT US
Email: support@ainvest.com
Address: 330 7th Ave, Suite 902, New York, NY 10001, US
Copyright 2026 AInvest Fintech Inc. All rights reserved.
Comments
No comments yet