
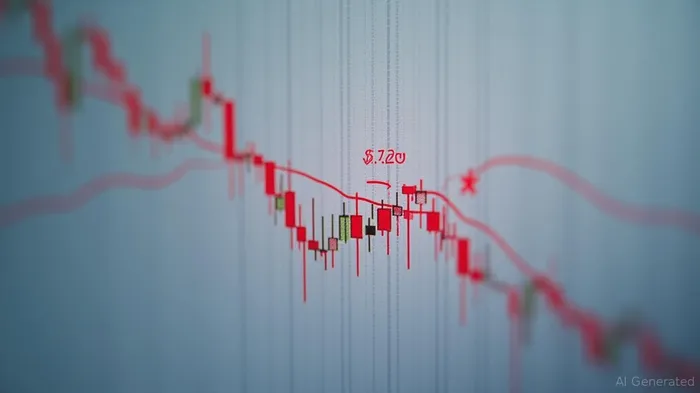
TIA Approaches $2.20 Resistance as Nine-Month Downtrend Faces Potential Reversal
Celestia (TIA) is currently testing the upper boundary of a long-term descending price channel, sparking speculation among traders and analysts that the bearish trend dominating the token for nearly nine months could be nearing a turning point. After forming a clear descending pattern since late November 2024, TIATIA-- has shown signs of renewed buying interest, particularly as it approaches the $2.20 resistance level [1]. If bulls manage to push the price beyond this key threshold, it could open the door to higher targets at $2.70, $3.38, and eventually $4.20.
The support structure for TIA has held firm at $1.70 and $1.40, with past rebounds and strong volume spikes indicating consistent buying activity during dips [1]. While the bearish trend remains intact, the recent price action suggests that momentum is shifting. On August 16, the token closed near $1.82 with a 2.88% session gain, marking a fresh high within the defined channel and signaling growing bullish influence. A confirmed breakout would invalidate the descending trendline and indicate a potential reversal in market sentiment.
Technical indicators are also showing early signs of strength. The RSI has moved above the 50 level, indicating improving momentum, while the MACD histogram is narrowing, suggesting consolidation ahead of a potential breakout [1]. Volume has spiked during key rallies toward $2.00 and rebounds from $1.60, further supporting the idea that buyers are stepping in at strategic price levels. These developments suggest that TIA is entering a critical phase, with the next few sessions likely to determine whether the price can break free from its long-standing downtrend.
From a broader perspective, a successful breakout could not only reverse the fortunes of TIA but also have implications for the decentralized data infrastructure space. As a key player in this sector, renewed strength in TIA could signal a shift in capital flow toward infrastructure projects. However, the outcome remains contingent on the wider crypto market environment, particularly the performance of BitcoinBTC-- and EthereumETH--, which continue to influence overall risk appetite.
Market cap data from mid-August further highlights the token’s volatility. TIA’s value surged from $1.28 billion to $1.50 billion, then retraced to below $1.32 billion before stabilizing near $1.35 billion by August 16 [1]. This consolidation pattern suggests that the market is still assessing the token’s next move. Traders and investors are now closely watching for confirmation of a breakout or breakdown, with either scenario likely to trigger a more defined directional trend.
Source: [1] TIA Tests Channel Resistance — Can Bulls Finally End the Nine-Month Downtrend? (https://cryptofrontnews.com/tia-tests-channel-resistance-can-bulls-final/)
Stay ahead of the market.
Get curated U.S. market news, insights and key dates delivered to your inbox.

AInvest
PRO
AInvest
PRO
Comments
No comments yet