
Thermo Fisher Shares Drop 3.65% As Bearish Signals Intensify Below Key Support
Generated by AI AgentAinvest Technical Radar
Tuesday, Jun 17, 2025 7:01 pm ET2min read
TMO--
Thermo Fisher (TMO) shares declined by 3.65% in the most recent session, closing at $390.28 after trading between $389.86 and $403.56. This movement occurred alongside elevated volume of 2.53 million shares, signaling intensified selling pressure.
Candlestick Theory
Recent sessions reveal a deteriorating technical structure. The price breakdown below $402.76 (June 13 low) triggered a Bearish Engulfing pattern on June 17, with the candle’s real body encompassing the previous two sessions’ gains. This pattern confirms $402–$415 as a new resistance zone, while the failure to hold psychological support at $390 exposes the $380–$385 region (December 2024 lows) as the next downside objective. The absence of reversal patterns like hammers or bullish engulfing suggests sustained bearish momentum.
Moving Average Theory
The 50-day, 100-day, and 200-day moving averages exhibit full bearish alignment, with the price trading below all three key averages. Crucially, the 50-day MAMA-- crossed below both the 100-day and 200-day MAs in early May, confirming a death cross. The 200-day MA at $515 now acts as a primary ceiling, while the steeply declining 50-day MA ($412) caps near-term rebound attempts. This configuration signals a well-established intermediate downtrend.
MACD & KDJ Indicators
The MACD histogram resides in negative territory (-7.2), with the signal line firmly above the MACD line, reflecting accelerating downside momentum. Meanwhile, KDJ registers oversold conditions (K=15, D=21, J=3), though recent J-line oscillations near zero lack bullish divergence. This MACD-KDJ confluence suggests oversold conditions lack reversal conviction, potentially extending the decline before a technical bounce.
Bollinger Bands
Volatility expansion is evident as price breaches the lower Bollinger Band ($404 ± $15), with bandwidthBAND-- expanding by 18% over the past five sessions. This breakdown confirms bearish momentum, with the lower band now acting as dynamic resistance near $405. Historically, such expansions resolve with mean-reversion toward the 20-day SMA ($415), but the absence of consolidation or bullish candles suggests further downside before stabilization.
Volume-Price Relationship
Distribution patterns dominate, with each significant down day (June 17: 2.53M shares; June 11: 3.06M) occurring on above-average volume, while rebounds (June 16: +0.58%; 1.97M shares) register reduced participation. The volume oscillator confirms this divergence, showing consistent negative readings throughout June. This volume signature validates the bearish trend’s sustainability.
Relative Strength Index (RSI)
The 14-day RSI at 31 nears oversold territory but lacks bullish divergence, as new price lows correspond to new RSI troughs. While technically oversold readings warrant caution, RSI failure to reach extreme sub-30 levels during prior declines (May 21: RSI=28) suggests additional downside may precede a durable low. This indicator’s bearish warning is amplified by its position below a declining trendline from April highs.
Fibonacci Retracement
Applying Fib levels to the July 2024 high ($623.77) and the current swing low ($389.86) identifies critical resistance thresholds. The 23.6% retracement ($445) aligns with March 2025 congestion, while the 38.2% level ($479) converges with the descending 200-day MA. This configuration strengthens resistance significance near $445–$450. Conversely, a sustained break below $390 targets the 100% projection at $380, with no intermediate supports of technical note below $400.
Confluence & Divergence
Confluence emerges between Bollinger Band breakdowns, volume-confirmed distribution, and Fibonacci resistance near $445. This multi-indicator agreement reinforces bearish dominance. However, KDJ and RSI diverge mildly, flagging short-term oversold conditions without confirming reversal signals. Given the overwhelming convergence of bearish evidence across trend, momentum, and volatility indicators, the technical structure suggests exhaustion bounces remain sellable opportunities unless price reclaims $415 decisively.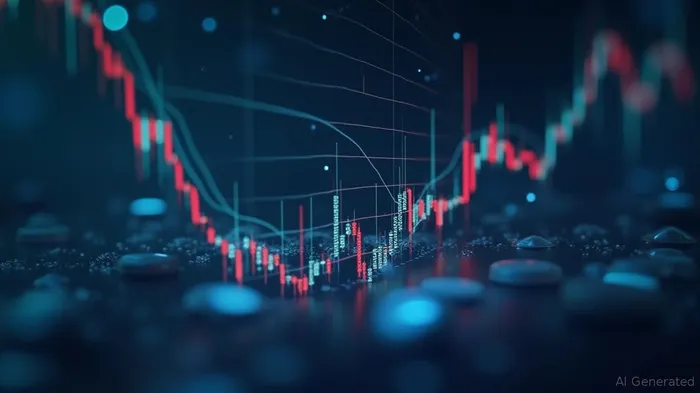
If I have seen further, it is by standing on the shoulders of giants.
Latest Articles
Stay ahead of the market.
Get curated U.S. market news, insights and key dates delivered to your inbox.
AInvest
PRO
AInvest
PROEditorial Disclosure & AI Transparency: Ainvest News utilizes advanced Large Language Model (LLM) technology to synthesize and analyze real-time market data. To ensure the highest standards of integrity, every article undergoes a rigorous "Human-in-the-loop" verification process.
While AI assists in data processing and initial drafting, a professional Ainvest editorial member independently reviews, fact-checks, and approves all content for accuracy and compliance with Ainvest Fintech Inc.’s editorial standards. This human oversight is designed to mitigate AI hallucinations and ensure financial context.
Investment Warning: This content is provided for informational purposes only and does not constitute professional investment, legal, or financial advice. Markets involve inherent risks. Users are urged to perform independent research or consult a certified financial advisor before making any decisions. Ainvest Fintech Inc. disclaims all liability for actions taken based on this information. Found an error?Report an Issue

ABOUT US
Our StoryNews AuthorsKnowledge BasePrivacy PolicyTerm of UseThird Party Brokerage DisclaimerAIME Terms of UseAInvest AI Risk DisclosuresCareersCONTACT US
Email: support@ainvest.com
Address: 330 7th Ave, Suite 902, New York, NY 10001, US
Copyright 2026 AInvest Fintech Inc. All rights reserved.
Comments
No comments yet