
THENATRY Breaks Below $6.10 With Bearish 5-Minute Engulf
Summary
• Price broke below $6.10, hitting $5.774 at 12:45 ET, with bearish momentum confirmed by falling RSI and MACD.
• Volatility spiked post-midnight, with 5.8k–5.9k levels showing contested support and resistance.
• A strong bearish engulfing pattern formed at 6:15 AM ET as price dropped from $5.83 to $5.834 within a 5-minute window.
Market Overview
THENA/Turkish Lira (THETRY) opened at $6.17 at 12:00 ET − 1, reached a high of $6.256, and fell to a low of $5.764 before closing at $5.831 at 12:00 ET. Total 24-hour volume was 4,348,215.6 and notional turnover was $25,602,739.55.
Structure & Formations
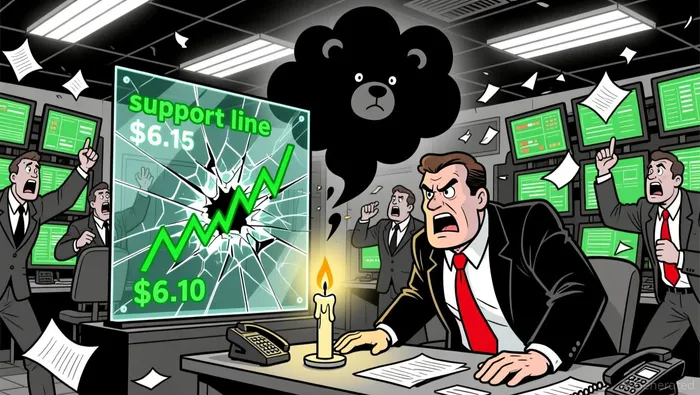
Price broke below a key $6.10 support level into a new intraday low near $5.774, forming a bearish breakdown pattern. A 5-minute bearish engulfing candle at 6:15 AM ET and a long bearish tail in the $5.83–$5.86 range signal strong short-term bear pressure. A potential support cluster appears between $5.78 and $5.80, though volume at these levels remains moderate.
Moving Averages
On the 5-minute chart, price has fallen significantly below its 20 and 50-period moving averages, reinforcing bearish momentum. Daily moving averages (50/100/200) suggest a longer-term bear trend is in place, with no immediate signs of reversal.
MACD & RSI
RSI dropped sharply to 31 by midday, indicating oversold conditions, but without a clear rebound, bear momentum appears to be intact. MACD remains in negative territory with bearish divergence, as price attempts to find support while momentum continues to weaken.
Bollinger Bands
Volatility increased overnight, with price reaching the lower Bollinger band at $5.774. A contraction phase was observed between 1:30 and 4:30 AM, followed by a sharp expansion as price broke to the downside.
Volume & Turnover
Volume spiked sharply at 6:15 and 6:30 AM ET, coinciding with the breakdown below $6.10. Turnover surged during these periods, confirming the move lower. However, volume at recent lows has been moderate, suggesting a potential consolidation phase ahead.
Fibonacci Retracements
From the recent 5-minute swing high of $6.256 and low of $5.764, the 38.2% retracement level is around $6.01, while the 61.8% level is near $5.895. These levels may serve as potential resistance should price attempt a near-term rebound.
Looking ahead, price could testTST-- support near $5.75–$5.77 if the current bearish momentum continues. Investors should watch for a potential bounce at the $5.83–$5.85 level, but risk remains skewed to the downside for the next 24 hours.
Decoding market patterns and unlocking profitable trading strategies in the crypto space
Latest Articles
Stay ahead of the market.
Get curated U.S. market news, insights and key dates delivered to your inbox.


AInvest
PRO
AInvest
PRO
Comments
No comments yet