
Texas Instruments Shares Drop 3.33% Following 8.43% Surge as Technical Indicators Signal Correction
Generated by AI AgentAinvest Technical RadarReviewed byAInvest News Editorial Team
Wednesday, Jan 7, 2026 8:47 pm ET2min read
TXN-- Aime Summary
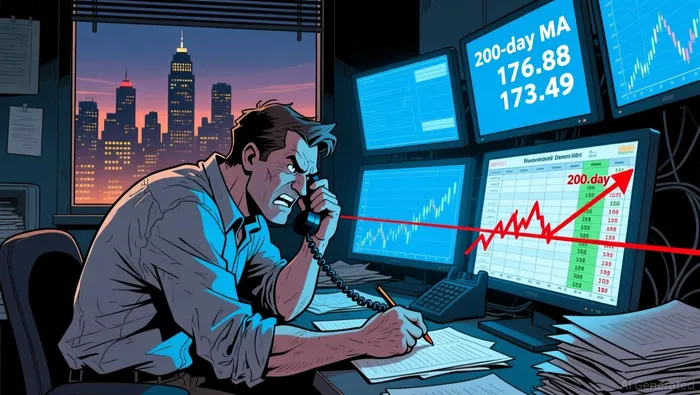 A break below $176.88 may trigger further testing of the $173.49 support, potentially validating a deeper correction.
Texas Instruments (TXN) closed the most recent session down 3.33%, marking a significant reversal after a prior 8.43% surge. This sharp correction suggests potential short-term bearish momentum, warranting a multi-indicator analysis to assess trend sustainability and reversal probabilities.
Candlestick Theory
Recent price action reveals a bearish engulfing pattern on the 2026-01-07 session, where the body of the candle fully engulfs the preceding bullish candle. Key support levels emerge at $176.88 (2025-12-26 close) and $173.49 (2025-12-31 close), with resistance at $182.10 (2025-12-06 high). The 2026-01-07 low of $184.49 near the 200-day moving average (calculated at ~$178.50) suggests a critical psychological barrier. A break below $176.88 may trigger further testing of the $173.49 support, potentially validating a deeper correction.Moving Average Theory
The 50-day MA (~$181.50), 100-day MA (~$183.00), and 200-day MA (~$178.50) form a bearish alignment, with the price below all three. The 50-day MA crossing below the 100-day MA (death cross) on 2026-01-05 confirms a medium-term downtrend. However, the 200-day MA acting as dynamic support may delay a sharp decline, creating a potential consolidation zone between $178.50 and $181.50.MACD & KDJ Indicators
The MACD (12,26,9) crossed below the signal line on 2026-01-05, with a bearish divergence emerging as the histogram narrows despite a price rebound on 2026-01-06. The KDJ (14,3,3) indicator shows an oversold condition on 2026-01-07 (K: 22, D: 28), but the slow stochastic remains in neutral territory. A close above $185.71 may trigger a bullish crossover in the KDJ, suggesting a short-term rebound could materialize if volume confirms.Bollinger Bands
Volatility expanded on 2026-01-06, with the 20-period Bollinger Bands reaching a width of ~$12.43. The recent close at $185.71 sits near the lower band, indicating oversold conditions. A reversal above the middle band (~$186.00) would suggest decreasing volatility and potential consolidation. The 2025-12-26 high of $178.52 marks a prior contraction point, hinting at a potential breakout target.Volume-Price Relationship
The 2026-01-07 session saw elevated volume (8.34M shares), validating the bearish breakdown. However, volume has trended lower since late December, suggesting waning short-term selling pressure. A surge in volume on a rebound above $185.71 would strengthen bullish conviction, while sustained low volume below $178.50 may confirm a deeper correction.Relative Strength Index (RSI)
The 14-period RSI stands at ~28 on 2026-01-07, entering oversold territory. A close above 35 would indicate a potential short-term bounce, though the RSI remains below 50, reflecting bearish momentum. A divergence between RSI and price (e.g., higher lows in RSI while price makes lower lows) could signal a trend reversal.Fibonacci Retracement
Key Fibonacci levels from the 2025-08-01 low ($206.49) to the 2025-09-03 high ($200.07) include 23.6% ($194.00), 38.2% ($189.00), 50% ($187.50), and 61.8% ($185.00). The current price near $185.71 aligns with the 61.8% retracement level, suggesting a potential support cluster. A break below $185.00 may target the 78.6% level at $181.50.Confluence and Divergences
The 61.8% Fibonacci level coincides with the 200-day MA and Bollinger Bands lower boundary, forming a high-probability support zone. However, the MACD divergence and RSI oversold reading suggest a short-term rebound may materialize. A failure to hold $178.50 would trigger a deeper correction toward $173.49, aligning with the 2025-12-31 low.If I have seen further, it is by standing on the shoulders of giants.
Latest Articles
Stay ahead of the market.
Get curated U.S. market news, insights and key dates delivered to your inbox.
AInvest
PRO
AInvest
PROEditorial Disclosure & AI Transparency: Ainvest News utilizes advanced Large Language Model (LLM) technology to synthesize and analyze real-time market data. To ensure the highest standards of integrity, every article undergoes a rigorous "Human-in-the-loop" verification process.
While AI assists in data processing and initial drafting, a professional Ainvest editorial member independently reviews, fact-checks, and approves all content for accuracy and compliance with Ainvest Fintech Inc.’s editorial standards. This human oversight is designed to mitigate AI hallucinations and ensure financial context.
Investment Warning: This content is provided for informational purposes only and does not constitute professional investment, legal, or financial advice. Markets involve inherent risks. Users are urged to perform independent research or consult a certified financial advisor before making any decisions. Ainvest Fintech Inc. disclaims all liability for actions taken based on this information. Found an error?Report an Issue

Comments
No comments yet