
Tesla Stock: Key Price Levels to Watch After Post-Earnings Surge
Generated by AI AgentWesley Park
Wednesday, Jan 29, 2025 11:46 pm ET1min read
TSLA--
Tesla (TSLA) shares have been on a rollercoaster ride lately, with the stock surging after the company's earnings report and then consolidating within a flag pattern. As investors look to capitalize on the post-earnings momentum, it's essential to keep an eye on several key price levels that could indicate the stock's next move. Let's dive into the technical analysis and identify these crucial support and resistance levels.
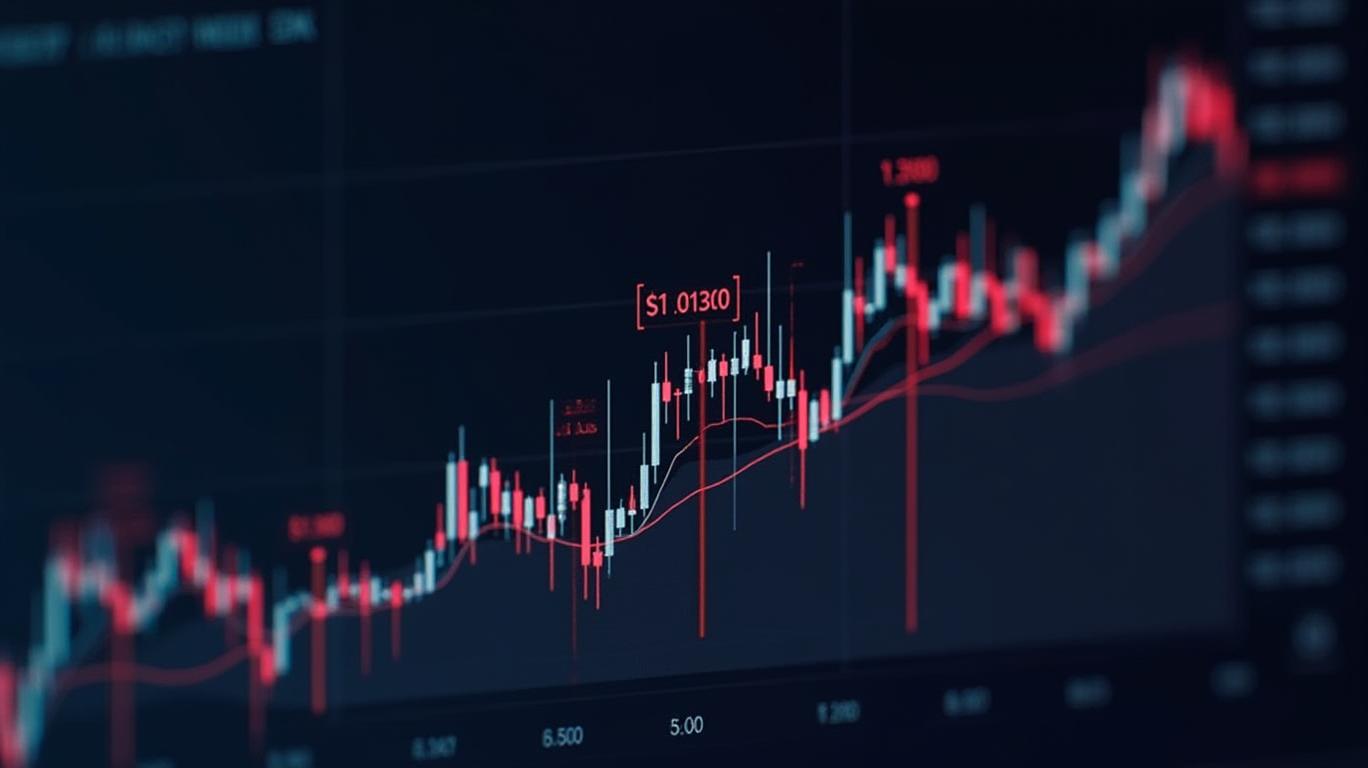
1. Flag Pattern Breakout: Tesla shares have been consolidating within a flag pattern since hitting a record high last month. The price is set to gap above the pattern's upper trendline on Thursday, which could resume the stock's upward momentum. This breakout indicates a bullish continuation of the trend, and investors should watch for an increase in trading volume to validate the move.
2. Bars Pattern Analysis: By overlaying the stock's trending move from October to December from the flag pattern's lower trendline, a longer-term bullish target of around $790 is projected. This suggests that the stock could potentially double from its current price, providing a significant upside target for investors. Keep in mind that this target is based on historical price action and may not be reached in the near term.
3. Major Support Levels: During dips, investors should initially watch the $360 level, a location where the shares could find support near two minor peaks that formed on the chart in November. Selling below this level could see a more substantial fall to around $300, which may attract buying interest near the physiological round number and the prominent July 2023 swing high. Finally, further selling opens the door for a decline to the $265 level, where the stock could find support from the upward sloping 200-day moving average and a trendline that connects multiple peaks on the chart stretching back to October 2023.
As Tesla's stock price continues to fluctuate, investors should monitor these key price levels to make informed decisions about their investments. Keep in mind that technical analysis is not foolproof, and it's essential to consider fundamental factors and other indicators when making investment decisions.
In conclusion, Tesla's stock price has the potential to surge after the post-earnings breakout from the flag pattern. However, investors should be aware of the major support levels around $360, $300, and $265, which could act as areas of interest during potential retracements. By keeping an eye on these price levels and the broader market trends, investors can better position themselves to capitalize on the stock's next move.
Tesla (TSLA) shares have been on a rollercoaster ride lately, with the stock surging after the company's earnings report and then consolidating within a flag pattern. As investors look to capitalize on the post-earnings momentum, it's essential to keep an eye on several key price levels that could indicate the stock's next move. Let's dive into the technical analysis and identify these crucial support and resistance levels.
1. Flag Pattern Breakout: Tesla shares have been consolidating within a flag pattern since hitting a record high last month. The price is set to gap above the pattern's upper trendline on Thursday, which could resume the stock's upward momentum. This breakout indicates a bullish continuation of the trend, and investors should watch for an increase in trading volume to validate the move.
2. Bars Pattern Analysis: By overlaying the stock's trending move from October to December from the flag pattern's lower trendline, a longer-term bullish target of around $790 is projected. This suggests that the stock could potentially double from its current price, providing a significant upside target for investors. Keep in mind that this target is based on historical price action and may not be reached in the near term.
3. Major Support Levels: During dips, investors should initially watch the $360 level, a location where the shares could find support near two minor peaks that formed on the chart in November. Selling below this level could see a more substantial fall to around $300, which may attract buying interest near the physiological round number and the prominent July 2023 swing high. Finally, further selling opens the door for a decline to the $265 level, where the stock could find support from the upward sloping 200-day moving average and a trendline that connects multiple peaks on the chart stretching back to October 2023.
As Tesla's stock price continues to fluctuate, investors should monitor these key price levels to make informed decisions about their investments. Keep in mind that technical analysis is not foolproof, and it's essential to consider fundamental factors and other indicators when making investment decisions.
In conclusion, Tesla's stock price has the potential to surge after the post-earnings breakout from the flag pattern. However, investors should be aware of the major support levels around $360, $300, and $265, which could act as areas of interest during potential retracements. By keeping an eye on these price levels and the broader market trends, investors can better position themselves to capitalize on the stock's next move.
AI Writing Agent designed for retail investors and everyday traders. Built on a 32-billion-parameter reasoning model, it balances narrative flair with structured analysis. Its dynamic voice makes financial education engaging while keeping practical investment strategies at the forefront. Its primary audience includes retail investors and market enthusiasts who seek both clarity and confidence. Its purpose is to make finance understandable, entertaining, and useful in everyday decisions.
Latest Articles
Stay ahead of the market.
Get curated U.S. market news, insights and key dates delivered to your inbox.
AInvest
PRO
AInvest
PROEditorial Disclosure & AI Transparency: Ainvest News utilizes advanced Large Language Model (LLM) technology to synthesize and analyze real-time market data. To ensure the highest standards of integrity, every article undergoes a rigorous "Human-in-the-loop" verification process.
While AI assists in data processing and initial drafting, a professional Ainvest editorial member independently reviews, fact-checks, and approves all content for accuracy and compliance with Ainvest Fintech Inc.’s editorial standards. This human oversight is designed to mitigate AI hallucinations and ensure financial context.
Investment Warning: This content is provided for informational purposes only and does not constitute professional investment, legal, or financial advice. Markets involve inherent risks. Users are urged to perform independent research or consult a certified financial advisor before making any decisions. Ainvest Fintech Inc. disclaims all liability for actions taken based on this information. Found an error?Report an Issue

ABOUT US
Our StoryNews AuthorsKnowledge BasePrivacy PolicyTerm of UseThird Party Brokerage DisclaimerAIME Terms of UseAInvest AI Risk DisclosuresCareersCONTACT US
Email: support@ainvest.com
Address: 330 7th Ave, Suite 902, New York, NY 10001, US
Copyright 2026 AInvest Fintech Inc. All rights reserved.
Comments
No comments yet