
Tapestry Surges 6.22% on Three-Day 19.74% Rally as Technical Indicators Signal Strong Bullish Momentum
Tapestry (TPR) has surged 6.22% on the most recent session, extending a three-day rally with a cumulative gain of 19.74%. This sharp price action, coupled with elevated trading volume (e.g., $490 million on 2026-02-06), suggests strong institutional participation and bullish momentum. The recent price trajectory forms a bullish engulfing pattern, with the last three candles closing near highs, indicating a potential continuation of the upward trend. Key support levels emerge around $124.31 (Feb 4 low) and $125.92 (Jan 30 low), while resistance is evident at $153.13 (Feb 6 high).
Candlestick Theory highlights the significance of these levels, as a breakdown below $124.31 may trigger a retest of prior troughs, whereas a sustained close above $153.13 could confirm a new bullish phase. The formation of a higher high and higher low structure over the past week reinforces the validity of the uptrend, though a bearish reversal pattern 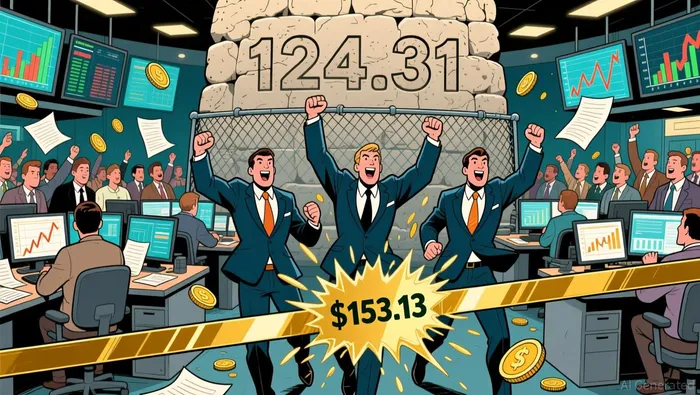 (e.g., a shooting star or evening star) near resistance may signal caution if volume wanes.
Moving Average Theory reveals a bullish alignment across short- and long-term horizons. The 50-day MA (estimated at ~$135) is likely above the 200-day MA (~$115), forming a golden cross earlier in the year. The 100-day MA (~$128) is currently acting as dynamic support, with price hovering above it. This confluence suggests a medium-term bullish bias, though traders should monitor the 200-day MA as a critical trend filter. A crossover below the 50-day MA may indicate a weakening of the short-term momentum.
MACD & KDJ Indicators show TapestryTPR-- in overbought territory, with the MACD histogram expanding and the KDJ stochastic oscillator registering a fast stochastic reading above 80. This suggests heightened momentum, though it may also indicate a potential pullback if the MACD line fails to stay above the signal line. Divergence between the KDJ and price action (e.g., lower highs in the oscillator despite higher price highs) could signal a deceleration in buying pressure.
Bollinger Bands reflect a period of high volatility, with price near the upper band on recent sessions. The bands have widened since late January, consistent with the sharp price run-up. A contraction in band width may precede a breakout, but the current position near the upper band suggests continuation of the trend is more probable than a reversal.
Volume-Price Relationship validates the sustainability of the recent rally. Volume has spiked on up days (e.g., $490 million on Feb 6) and declined on down days (e.g., $246 million on Feb 3), aligning with the price action. A divergence between rising prices and declining volume would raise caution, but the current volume profile supports the notion of strong follow-through demand.
RSI has surged above 70, entering overbought territory, which historically may indicate a short-term correction. However, in a strong uptrend, RSI can remain elevated for extended periods. A move below 60 may signal a retracement, but a sustained close above 70 would reinforce the bullish case.
Fibonacci Retracement levels from the recent high ($153.13) to the prior low ($124.37) highlight key psychological thresholds. The 38.2% retracement level (~$144.38) and 50% level (~$138.75) are critical for potential pullbacks. A breach of the 61.8% level (~$130.08) would raise concerns about trend integrity.
Confluence between the moving averages, RSI, and Bollinger Bands suggests a strong continuation of the uptrend, while divergences in the KDJ and RSI may hint at near-term volatility. The alignment of volume with price action further validates the bullish thesis. However, traders should remain cautious of overbought conditions and potential exhaustion near key Fibonacci levels. A breakdown below the 50-day MA or a failure to hold above $124.31 may trigger a reassessment of the trend. Probabilistically, the setup favors a continuation of the rally, but risk management is essential given the heightened momentum.
If I have seen further, it is by standing on the shoulders of giants.
Latest Articles
Stay ahead of the market.
Get curated U.S. market news, insights and key dates delivered to your inbox.
AInvest
PRO
AInvest
PRO
Comments
No comments yet