
Synchrony Financial Extends Losses to 2.66% as Bearish Signals Intensify
Generated by AI AgentAinvest Technical Radar
Friday, Jun 6, 2025 6:48 pm ET2min read
SYF--
Synchrony Financial (SYF) fell 0.73% to $57.45 in its latest session, extending its losing streak to two consecutive days with a cumulative decline of 2.66%. This decline highlights ongoing short-term bearish pressure and sets the stage for a multi-faceted technical assessment.
Candlestick Theory
Recent candlestick patterns reveal a bearish reversal signal. The June 3rd session (close: $59.02) formed a green candle, but subsequent days generated two consecutive red candles with lower highs and lows, culminating in a June 5th close at $57.45. This structure resembles a bearish engulfing pattern following the June 4th decline (-1.95%), suggesting waning bullish momentum. Key resistance now clusters near $59.00–$59.50, aligning with recent swing highs, while immediate support resides at $57.00–$56.50. A break below $56.50 would expose the May 23rd low of $55.67.
Moving Average Theory
The 50-day moving average (approximately $58.20) recently crossed below the 100-day MA (near $57.80), signaling deteriorating medium-term momentum. The current price ($57.45) trades below both these averages, confirming short-term bearish control. However, the long-term 200-day MA (roughly $52.50) maintains an upward slope, and the price remains well above this level, preserving the broader uptrend. This divergence between short-term weakness and long-term strength may indicate consolidation within the primary bull cycle.
MACD & KDJ Indicators
The MACD histogram is negative, with the signal line above the MACD line, reinforcing bearish momentum. Concurrently, the KDJ oscillator (particularly the %K and %D lines) is descending toward oversold territory (sub-30), though no bullish crossover is yet evident. While these indicators align in signaling downside momentum, the proximity of KDJ to oversold levels warrants vigilance for a potential reversal if bullish convergence materializes near support zones.
Bollinger Bands
Bollinger Bands are contracting after a period of expansion in late May, indicating reduced volatility. Price action is testing the lower band (~$57.00), which, combined with the band squeeze, suggests imminent directional resolution. A sustained break below the lower band would intensify bearish momentum, while a rebound toward the middle band ($58.50) could signal stabilization. The compression phase heightens the significance of a breakout/breakdown in the coming sessions.
Volume-Price Relationship
Volume patterns validate bearish sentiment. The June 4th decline (-1.95%) occurred on elevated volume (2.69 million shares), confirming distribution. While the June 5th drop saw slightly lower volume (2.52 million), it still exceeded the 30-day average, indicating persistent selling pressure. This divergence between rising volume on down days and inadequate volume on recovery attempts underscores fragile price sustainability.
Relative Strength Index (RSI)
The 14-day RSI (currently ~42) is declining but remains above oversold territory (<30). While not yet signaling an extreme, the downward trajectory reinforces near-term bearish bias. Historically, SYF’s RSI has rebounded from oversold levels (e.g., mid-April 2025), making the $30-$35 RSI zone critical to monitor. Investors should note that RSI alone is a lagging warning; confirmation from trend or volume indicators is essential for reversal validation.
Fibonacci Retracement
Applying Fibonacci retracement to the swing low of $42.10 (April 9, 2025) and high of $61.51 (May 14, 2025), key levels emerge. The 23.6% retracement ($56.93) was tested on June 5th (low: $56.98), offering immediate support. A breach exposes the 38.2% level at $54.10, followed by the 50% retracement at $51.80. Confluence exists near $57.00–$56.90, where the 23.6% Fibonacci aligns with horizontal price support, amplifying its technical relevance for buyers.
Confluence and Divergence
Confluence is notable at $57.00–$56.90, where Fibonacci support, the psychological $57.00 level, and Bollinger’s lower band converge, potentially stabilizing declines. Bearish alignment exists between MACD, moving averages, and volume signals. Divergence is absent currently; however, should RSI or KDJ form bullish divergences while the price establishes a base, it could foreshadow a reversal. The most probable near-term outcome is extended consolidation between $57.00 and $59.00, pending a catalyst-driven breakout.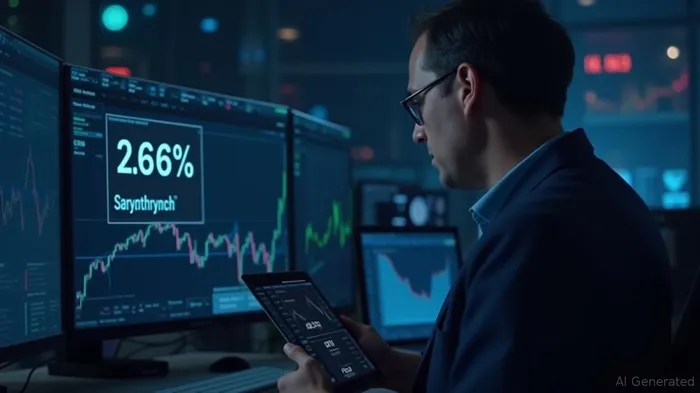
If I have seen further, it is by standing on the shoulders of giants.
Latest Articles
Stay ahead of the market.
Get curated U.S. market news, insights and key dates delivered to your inbox.
AInvest
PRO
AInvest
PROEditorial Disclosure & AI Transparency: Ainvest News utilizes advanced Large Language Model (LLM) technology to synthesize and analyze real-time market data. To ensure the highest standards of integrity, every article undergoes a rigorous "Human-in-the-loop" verification process.
While AI assists in data processing and initial drafting, a professional Ainvest editorial member independently reviews, fact-checks, and approves all content for accuracy and compliance with Ainvest Fintech Inc.’s editorial standards. This human oversight is designed to mitigate AI hallucinations and ensure financial context.
Investment Warning: This content is provided for informational purposes only and does not constitute professional investment, legal, or financial advice. Markets involve inherent risks. Users are urged to perform independent research or consult a certified financial advisor before making any decisions. Ainvest Fintech Inc. disclaims all liability for actions taken based on this information. Found an error?Report an Issue

ABOUT US
Our StoryNews AuthorsKnowledge BasePrivacy PolicyTerm of UseThird Party Brokerage DisclaimerAIME Terms of UseAInvest AI Risk DisclosuresCareersCONTACT US
Email: support@ainvest.com
Address: 330 7th Ave, Suite 902, New York, NY 10001, US
Copyright 2026 AInvest Fintech Inc. All rights reserved.
Comments
No comments yet