
Sylvamo (SLVM) Surges Over 10%: A Technical Breakout or Earnings Trap?
 Aime Summary
Summary
• SylvamoSLVM-- (SLVM) stock jumps 10.14% intraday to $41.61, defying recent bearish analyst sentiment.

• Second Quarter earnings reveal a $11 million net loss but a robust $60 million Adjusted EBITDA, signaling operational resilience.
• North American segment leads profitability with $50 million operating profit, offsetting European and Latin American struggles.
• Market consensus remains cautious with a "Reduce" rating, yet the 25.32% upside potential from the $47.33 average price target keeps eyes on the ticker.
Following a sharp intraday rally that pushed shares to a high of $41.85 and a low of $38.77, Sylvamo has captured significant market attention. Despite reporting a net loss and facing headwinds from maintenance outages and tariff uncertainties, the market appears to be pricing in the strong operational cash flows and the CEO's optimistic outlook for the second half of 2026.
Operational Efficiency Drives Unexpected Rally
The primary catalyst for Sylvamo's 10% surge is the market's reaction to its Q2 earnings release, which highlighted a stark divergence between GAAP losses and underlying operational strength. While the company posted a net loss of $11 million due to a $12 million non-cash valuation allowance on deferred tax assets, the core business generated $60 million in Adjusted EBITDA, a significant improvement from the $29 million in Q1. Management emphasized that North American operations delivered $50 million in operating profit, driven by successful price increases and lower input costs. Furthermore, CEO John Sims projected a much stronger second half, citing the completion of strategic investments at the Eastover mill and the normalization of capital spending, which investors are interpreting as a clear path to generating $300 million in annual free cash flow.
Paper & Forest Products: Sylvamo Outpaces Sector Leader
In the Paper & Forest Products sector, Sylvamo’s performance stands in sharp contrast to its peers. While the sector leader, International Paper (IP), saw a modest intraday gain of 2.68%, Sylvamo’s 10.14% surge demonstrates a disproportionate investor appetite for its turnaround narrative. Unlike broader sector trends that may be weighed down by global supply chain frictions, Sylvamo’s rally is specifically fueled by its successful execution of uncoated freesheet price increases across all regions and the anticipated volume benefits from the Riverdale supply agreement termination. This relative outperformance suggests that capital is rotating into Sylvamo specifically for its operational leverage and margin expansion potential rather than general sector beta.
Technical Breakout Analysis & High-Leverage Options Play
Technical indicators present a complex but bullish setup for SLVMSLVM--, as the stock breaks through key resistance levels despite being in a long-term bearish trend. Key technical statistics include:
• MACD: -0.1368 (Signal: -0.2264), Histogram: +0.0896 (Bullish crossover forming)
• RSI: 47.15 (Neutral, room for upward momentum)
• 30-Day Moving Average: 38.28 (Price is well above, indicating short-term strength)
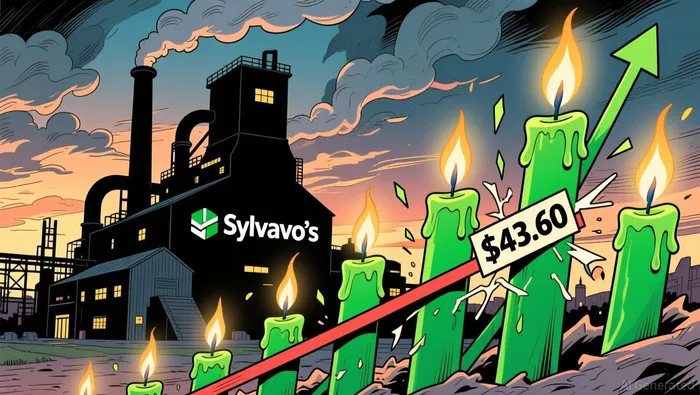
• 200-Day Moving Average: 43.60 (Price is approaching this major long-term resistance)
The stock has decisively broken above its 30-day support zone of $38.25–$38.30 and is now challenging the 200-day moving average at $43.60. The positive MACD histogram suggests momentum is shifting upward, while the neutral RSI indicates the stock is not yet overbought, leaving room for further upside before hitting technical ceilings. Traders should watch the $43.60 level closely; a sustained break above this mark could trigger a short squeeze toward the 52-week high of $56.80.
Based on the options chain, we identify two high-potential contracts for aggressive traders seeking leveraged exposure to this momentum:
• SLVM20260821C40SLVM20260821C40-- (Call Option): Strike $40.00, Expiration 2026-08-21. IV Ratio: 32.52% (Moderate), Leverage: 34.52%, Delta: 0.7117 (High sensitivity to price), Theta: -0.0260 (Low time decay), Gamma: 0.1245 (High acceleration). This contract stands out for its high delta and gamma, offering substantial leverage with minimal time decay risk given the near-term expiration. It is ideal for traders betting on a continued immediate surge.
• SLVM20260821P40SLVM20260821P40-- (Put Option): Strike $40.00, Expiration 2026-08-21. IV Ratio: 57.08% (High), Leverage: 33.14%, Delta: -0.3589 (Moderate sensitivity), Theta: -0.0552 (Moderate time decay), Gamma: 0.0779 (Moderate acceleration). This contract offers a balanced risk/reward profile for hedging or betting on a pullback, with a moderate delta that allows for significant percentage gains if the stock retraces from current highs.
Options Payoff Calculation Primer: Assuming a 5% upside scenario where SLVM reaches $43.69, the Call Option payoff is max(0, 43.69 - 40.00) = $3.69 per share. For the Put Option, the payoff is max(0, 40.00 - 43.69) = $0, rendering it worthless. This projection highlights the asymmetric risk/reward in favor of calls in a bullish breakout scenario.
If $43.60 breaks, SLVM20260821C40 offers explosive upside potential for momentum traders.
Monitor $43.60 Resistance for Breakout Confirmation
The current rally in Sylvamo appears sustainable in the short term, driven by strong operational metrics and a clear management narrative of recovery. However, the 200-day moving average at $43.60 represents a formidable technical barrier. Investors should watch for a decisive close above this level to confirm a trend reversal, or a rejection that could signal a return to consolidation. Keep a close eye on sector leader International Paper (IP), which rose 2.68% today; its stability provides a supportive backdrop for Sylvamo's continued advance. Action-oriented insight: Watch for a breakout above $43.60 to confirm bullish momentum or a rejection that signals a return to range-bound trading.

TickerSnipe provides professional intraday stock analysis using technical tools to help you understand market trends and seize short-term trading opportunities.
Latest Articles
Stay ahead of the market.
Get curated U.S. market news, insights and key dates delivered to your inbox.


AInvest
PRO
AInvest
PRO




Comments
No comments yet