
Swinging into Profits: A Technical Analysis of Top Charts of the Week
In the ever-fluctuating world of the stock market, savvy swing traders are always on the lookout for the next big opportunity. This week, the spotlight falls on two major players: Microsoft (MSFT) and Tesla (TSLA), each presenting a unique landscape for potential profits. Let's dive into the technical analysis of these stocks to uncover the opportunities and risks they present. Before we delve into individual stocks, it's crucial to understand the broader economic context. This week, the economic data revealed a higher-than-expected rise in February's Producer Price Index (PPI) and a less robust increase in retail sales compared to forecasts. These developments signal inflationary pressures and consumer spending concerns, prompting market participants to adjust their expectations regarding the Federal Reserve's monetary policy direction. This shift notably affected bond markets, where Treasury yields saw significant increases across various maturities. Microsoft stock has broken out of a wedge shape with a robust uptrend, as depicted by the ascending yellow trend line. The stock is trading above its 20-day, 50-day, and 200-day moving averages, signaling bullish momentum across short, medium, and long-term perspectives. A notable bullish crossover of the 20-day and 50-day moving averages in October 2023 further underscores the stock's vigorous ascent. This bullish sentiment is reinforced by the moving averages and price diverging and rising. Moving Average Convergence Divergence (MACD): The MACD line's bullish crossover over the signal line and its position above this signal line indicate the strength of the upward trend. Relative Strength Index (RSI): With an RSI of 65, the stock has not reached an overbought state and could potentially extend gains before hitting the typically overbought threshold of 70. On the contrary, the Tesla chart has taken a nosedive. It broke the support level of $167 and continued to slide, trading below its 20-day, 50-day, and 200-day moving averages, signaling bearish momentum across short, medium, and long-term perspectives. A notable bearish crossover occurred in January when the stock price broke the 200-day EMA. Moving Average Convergence Divergence (MACD): The MACD line's bearish crossover and its position above the signal line indicate the strength of the downward trend. Relative Strength Index (RSI): With an RSI of 25, the stock has been oversold and falls below the threshold of 30, suggesting that the current downward trend is likely to reverse in the immediate future. This week's analysis of MSFT and TSLA presents a tale of two trajectories. MSFT's bullish breakout provides an enticing opportunity for swing traders looking to ride the upward trend, while TSLA's bearish descent signals caution but also hints at a potential reversal for the risk-tolerant trader. As always, it's crucial to monitor these stocks closely and be prepared to adjust positions based on evolving market conditions and technical indicators.
Economic Backdrop
Microsoft (MSFT): A Bullish Breakout
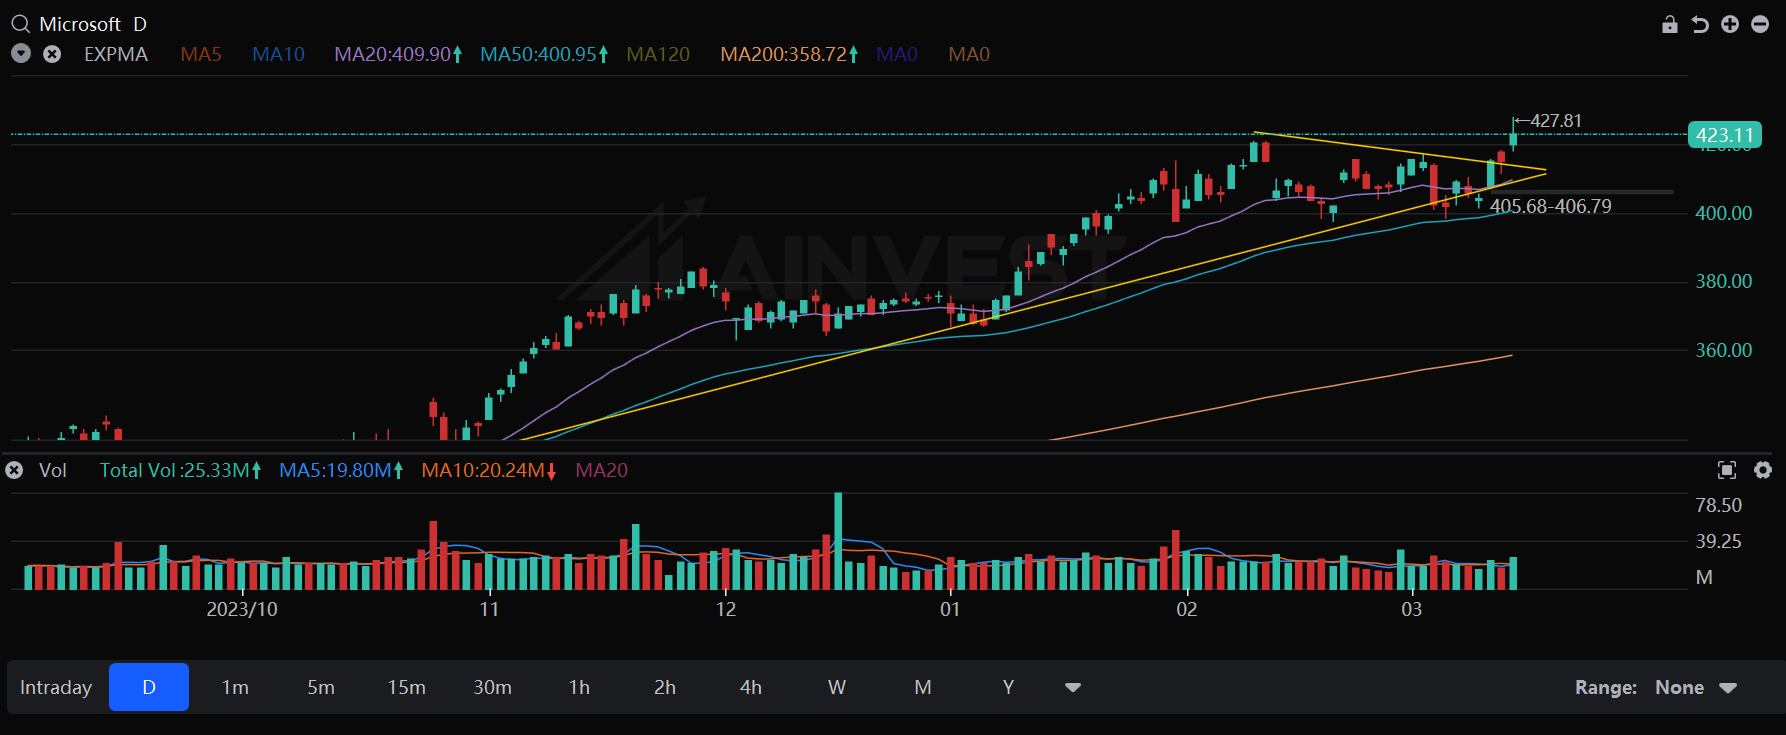
Technical Indicators:
Tesla (TSLA): A Bearish Descent
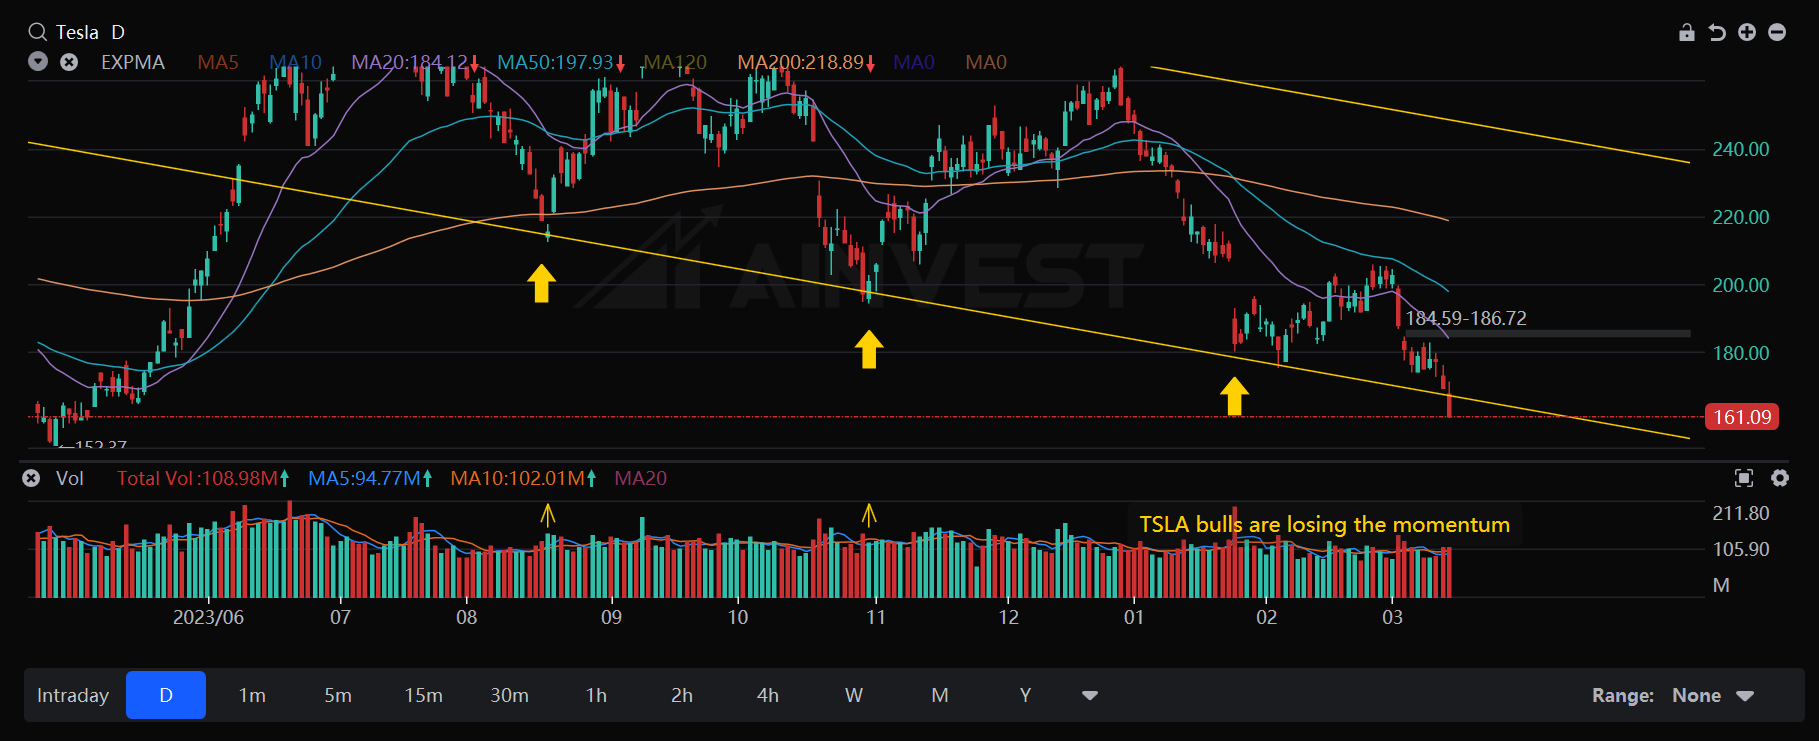
Technical Indicators:
Conclusion
Stay ahead of the market.
Get curated U.S. market news, insights and key dates delivered to your inbox.
AInvest
PRO
AInvest
PRO
Comments
No comments yet