
Sunbelt Rentals Fell 9 Straight Days Into a Dated Index Buyer—$61 and Sept 10 Decide Whether Sellers Get Trapped
 Aime Summary
Sunbelt Rentals (NYSE: SUNB) just strung together nine consecutive losing sessions, cutting the stock about 16% and erasing roughly $5.3 billion of market value—while the S&P 500 drifted down only about 1% over the same stretch. This was never the broader tape doing the work. It was SUNBSUNB--, and only SUNB, being sold for nine straight days.
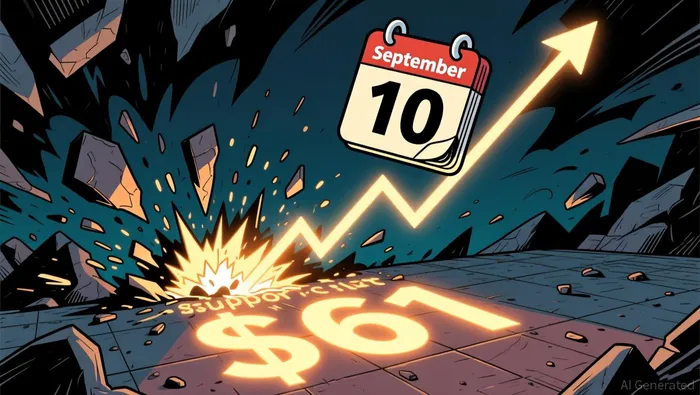
Now meet the fact most of that tape is ignoring: on Sept. 10, Bloomberg reconstitutes its 500 Index, and Sunbelt RentalsSUNB-- has just been added to it. Passive funds that track the benchmark have to buy the stock before the open that day, whether they want to or not. The addition was announced Aug. 26. The stock has sold off nearly every session since. That is the setup worth studying—a momentum slide running headlong into a dated, price-insensitive buyer.

Where the chart stands
Entering Sept. 3, SUNB sits at $67.11—down about 16% over 20 sessions and nearly 10% over the past five. Relative strength is bone-dry at about 29, deep in oversold territory. The 14-day average true range is $2.83, roughly 4.2% of the share price, so every session is swinging hard. And the price is trapped a full $8 under the 50-day moving average of $75.20.
The swing is unusually violent for a stock whose 52-week path runs from $86.68 at the highs down to $61.03 at the lows. What matters is that the current quote still sits roughly 10% above that $61.03 floor. The line has been visited, tested, and defended; it is the only real memory on this chart.
The trap and the deadline
Strip out the machinery and the contest is plain. Passive money tracking the Bloomberg 500 must accumulate SUNB shares before Sept. 10 regardless of price. The traders who pressed the short side through nine down days now face a dated buyer that stops caring about the quote. That is the mechanical setup for a squeeze—but a squeeze needs ignition, not just fuel.
Flow data for the Sept. 2 session shows block and retail money both net-selling on the day, so the marginal participant is still dumping. A reversal here needs the force to shift: SUNB holding the $61 zone and reclaiming the $67–$68 area (last session's intraday high was $68.005). That is the same zone where momentum sellers opened their latest positions. Above it, this stops being a falling knife and becomes a deadline for the people who pressed the slide.
The decision map
Everything now runs through the 52-week low of $61.03. Hold it into the Sept. 10 reconstitution and the dated index buyer gains the upper hand—a reclaim and hold of the $68 area puts the $71.66–$73.20 shelf in play, where last month's buyers sit trapped, and then the 50-day near $75.20. Break $61.03 on a close and the chart loses its floor; the trap never springs and the slide owns the tape.
| Scenario | Trigger | Path | What kills it |
|---|---|---|---|
| Bear trap / squeeze | Hold above $61.03; reclaim and hold ~$68 | $71.66–$73.20 shelf, then the 50-day near $75.20 | A close below $61.03 |
| Slide continues | Lose $61.03 on a close | Momentum reasserts; no recent floor to lean on | — |
Set the asymmetry next to the clock. The reward path is roughly a 9% run to the $71.66–$73.20 ceiling versus roughly 10% of daylight to the invalidation at $61.03—nearly 1-for-1 on price, which is why the trade is not the level but the timing. The edge here is that the Sept. 10 reconstitution gives both sides a hard date. A buyer who needs shares this week can be expected to defend the $61 floor; a seller who waits through the index add risks handing fuel to whoever is waiting for the squeeze.
None of this is a reason to chase the current quote. The setup is a trigger game, not a dip-buy: wait for the $67–$68 reclaim with the $61 low still intact before treating the reversal as live, and treat a close under $61 as the map tearing up. Hold $61 through Sept. 10 and the trap stays cocked; lose it and the nine-day seller wins the argument.

Stay ahead of the market.
Get curated U.S. market news, insights and key dates delivered to your inbox.


AInvest
PRO
AInvest
PRO




Comments
No comments yet