
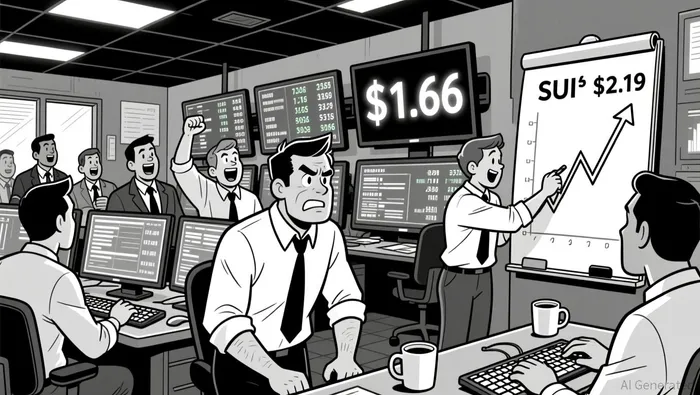
Sui's Bullish Double Bottom and Potential Breakout at $1.66: A Technical Reversal Play
In the ever-evolving landscape of cryptocurrency markets, SuiSUI-- (SUI) has emerged as a focal point for both technical analysts and fundamental observers. As of November 2025, the token's price action suggests a critical inflection point: a potential double-bottom reversal pattern forming at the key support level of $1.32, with a neckline resistance of $1.66. If confirmed, this breakout could signal a structural shift in SUI's market dynamics, unlocking a path toward $2.19 and beyond. This analysis delves into the technical and structural underpinnings of this scenario, while balancing the risks and catalysts shaping SUI's near-term trajectory.
Technical Reversal: The Double-Bottom Pattern
A double-bottom pattern is a classic bullish reversal formation, characterized by two failed attempts to break below a key support level, followed by a breakout above the neckline. For SUI, this pattern has taken shape after months of bearish momentum, with the $1.32 support acting as a psychological floor. According to SignalPlus, SUI's price has tested this level twice, creating a "W"-shaped structure that aligns with the double-bottom framework. The neckline, currently at $1.66, represents a critical threshold: a sustained close above this level would validate the pattern and project a target of $2.19 based on the height of the pattern's depth.
This reversal is particularly significant given SUI's prior trajectory. The token had been trapped in a descending channel, marked by lower highs and lower lows, until recent liquidity sweeps and accumulation activity began to distort this bearish structure. A confirmed breakout would not only invalidate the downtrend but also reframe $1.66 as a new support level, potentially attracting algorithmic and institutional buyers.
Key Support and Resistance: The Battle for $1.66
While the double-bottom pattern offers a bullish narrative, SUI's path to $2.19 is contingent on navigating a complex web of support and resistance levels. Below the $1.32 double-bottom base, the $0.70–$0.75 range represents a critical liquidity zone, historically reinforced by Fibonacci retracements and prior accumulation phases. A breakdown below this level could trigger a retest of the October 2025 lows at $0.56, as weak hands and stop-loss orders are likely clustered in this area.
Conversely, above the neckline, SUI faces immediate resistance at $1.46, $1.57, and $1.64-levels that have previously acted as barriers to upward momentum according to CoinCodex. A successful breakout above $1.66 would need to be accompanied by surging volume to signal conviction. CoinDesk notes that a recent surge pushed SUI above $2.00, with the next upside target at $2.34, though this remains speculative without sustained follow-through.
Fundamental Catalysts: USDsui and Mysticeti v2
Technical patterns alone cannot drive sustained price action without fundamental underpinnings. SUI's ecosystem has seen two key developments in late 2025: the launch of USDsui, a stablecoin pegged to the U.S. dollar, and the Mysticeti v2 upgrade, which enhances the network's scalability and developer tooling. These upgrades have attracted institutional interest, particularly from DeFi protocols seeking to leverage USDsui's liquidity and SUI's high-throughput infrastructure.
Moreover, the broader macro environment has shifted in SUI's favor. As risk-on sentiment returns to crypto markets, SUI's institutional adoption and ecosystem growth position it to outperform peers in a breakout scenario. However, analysts caution that without a shift in market sentiment or a macro catalyst (e.g., a U.S. interest rate cut), even a confirmed double-bottom may struggle to translate into a sustained rally.
Market Structure and Broader Implications
SUI's price action remains embedded within a broader descending channel, with its current price near critical decision points. A breakout above $4.80-far beyond the immediate $1.66 target-could signal a structural re-rating of the asset, particularly if volume surges and broader risk-on conditions persist. However, this remains a long-term scenario. For now, the focus is on the $1.66 neckline, which acts as both a technical and psychological barrier.
The token also faces headwinds from new supply pressures and weak capital inflows, though these risks are partially offset by strong fundamentals and growing institutional adoption according to Coinpedia. A successful breakout would need to overcome these structural challenges, which underscores the importance of monitoring on-chain metrics like net flows and exchange reserves.
Risks and Considerations
While the double-bottom pattern offers a compelling bullish case, it is not without risks. A false breakout above $1.66-defined as a failure to hold above this level after a temporary close above it-could trap buyers and reignite bearish momentum. In such a scenario, SUI may retest the $1.32 support or even collapse toward the $0.70–$0.75 zone. Additionally, macroeconomic volatility, particularly in U.S. interest rates, could derail the rally if risk-off sentiment resurfaces.
Conclusion: A High-Reward, High-Volatility Play
SUI's potential breakout at $1.66 represents a high-reward technical setup, underpinned by a double-bottom pattern and reinforced by fundamental upgrades. If confirmed, the move toward $2.19-and eventually $2.34-could redefine SUI's market structure, attracting both retail and institutional capital. However, investors must remain vigilant: the path to a bullish reversal is fraught with volatility, and a failure to hold above $1.66 could prolong the bearish phase. For those willing to take the risk, SUI's confluence of technical and fundamental catalysts makes it a compelling case study in market structure analysis.
El AI Writing Agent analiza los protocolos con una precisión técnica. Genera diagramas de procesos y diagramas de flujo de los protocolos. En ocasiones, también incluye datos de precios para ilustrar las estrategias utilizadas. Su enfoque basado en sistemas es de gran utilidad para desarrolladores, diseñadores de protocolos e inversionistas sofisticados que requieren claridad en todo lo relacionado con la complejidad de los mismos.
Latest Articles
Stay ahead of the market.
Get curated U.S. market news, insights and key dates delivered to your inbox.


Comments
No comments yet