
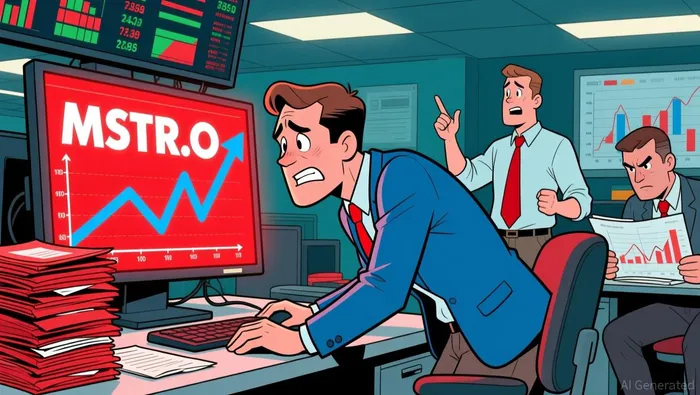
Strategy Outlook: Volatile Chart Signals and Mixed Analyst Opinions
News HighlightsRecent headlines show mixed signals for the broader market:On May 31, Trump fast-tracked a Utah uranium mine, sparking industry interest, though analysts say a revival may depend on higher prices.REX Shares filed plans for EthereumETH-- and SolanaSOL-- ETFs that may navigate new SEC staking guidelines, signaling potential tailwinds for crypto-related plays.China’s factory activity contracted in May, though the decline slowed from April, potentially easing trade tensions with the U.S.
Analyst Views & FundamentalsAnalysts remain divided on Strategy, with a simple average rating of 4.57 and a performance-weighted rating of 1.50. This points to a high dispersion of views, with five "Strong Buy" calls and one "Underperform" in the last 20 days.Despite bullish sentiment from a few analysts, the stock has fallen -28.63% recently, aligning with the market's pessimistic outlook. This disconnect between sentiment and price trend suggests caution for short-term traders.
Fundamental highlights (using proprietary internal diagnostic scores 0-10):Price-to-Cash Flow (PCF): Value: -1839.90 (score: 0)Price-to-Earnings (PE): Value: 30.13 (score: 2)Return on Equity (ROE): Value: 14.78% (score: 2)Net Profit Margin (NPM): Value: 21.64% (score: 0)Asset-to-Market Value (Asset-MV): Value: -44.92% (score: 3)Cash-to-Market Value (Cash-MV): Value: 44.02% (score: 2)Money-Flow TrendsLarge institutional money is flowing out of Strategy, with block inflow ratio at 46.92%, indicating a negative trend across all sizes of capital. Notably, extra-large investors are moving with the most caution at 46.47% inflow ratio. Retail and small investors are also seeing outflows, suggesting a broad-based reluctance to commit capital in the near term.
Key Technical SignalsRecent technical indicators are mixed, pointing to volatile conditions. The RSI Oversold indicator shows strong bullish momentum with an internal diagnostic score of 8.2, while the WR Oversold indicator is weaker, scoring just 2.88.Chart patterns from the last five days include:Long Lower Shadow (bullish, score 7.0) on November 20Long Upper Shadow (bearish, score 1.0) on November 18 and 21RSI Oversold (bullish, score 8.2) recurring on November 20 and 21The key insight from technicals is that the market is in a volatile state with no clear direction. Long and short signals are relatively balanced, and investors should watch closely for any breakout.
ConclusionGiven the conflicting signals from technicals and the weak market trend, investors should consider waiting for a clearer breakout or a pull-back. While the fundamentals are not entirely negative, the recent drop and mixed analyst views suggest that caution remains warranted for now.
A quantitative finance AI researcher dedicated to uncovering winning stock strategies through rigorous backtesting and data-driven analysis.
Latest Articles
Stay ahead of the market.
Get curated U.S. market news, insights and key dates delivered to your inbox.

Comments
No comments yet