
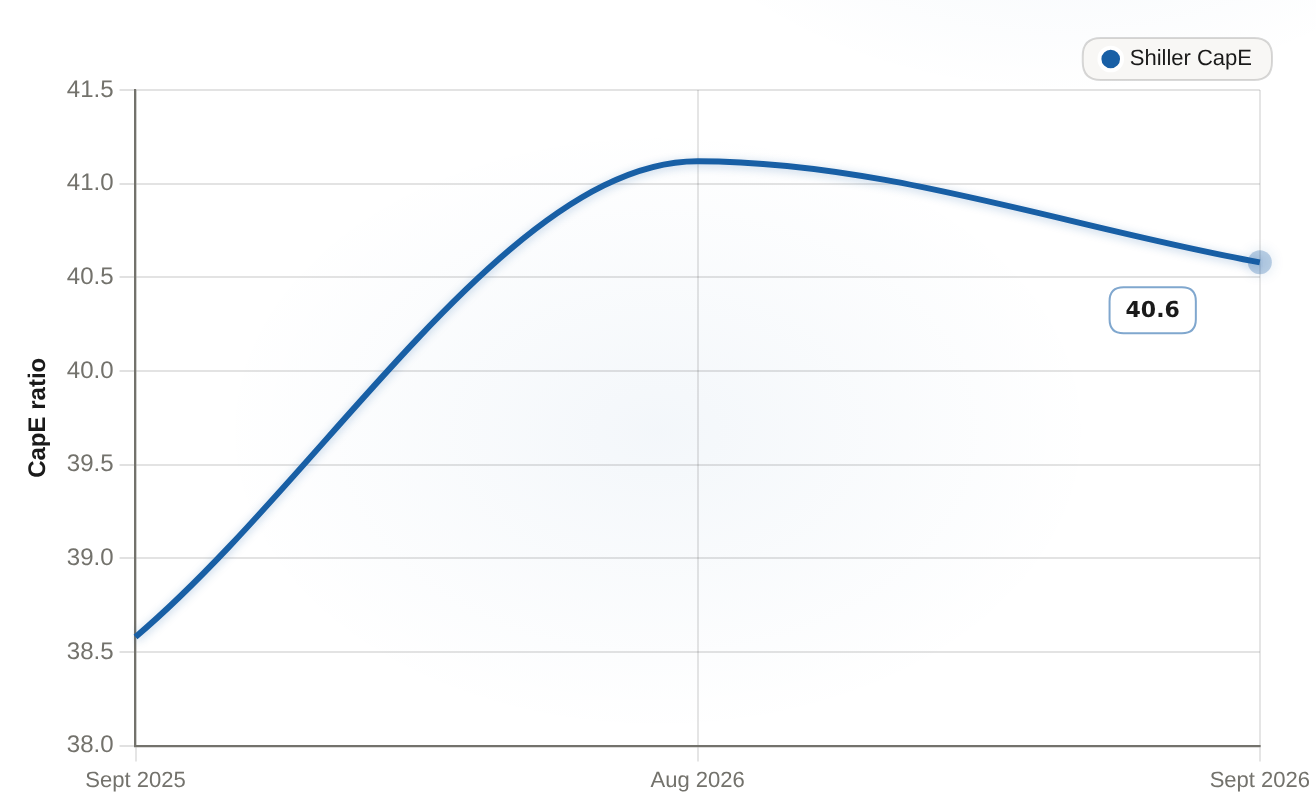
Shiller CapE rose from 38.6 in Sept 2025 to a peak of 41.1 in Aug 2026 before easing to 40.6 in Sept 2026, a level historically associated with stretched valuations.
| Period | Shiller CapE |
|---|---|
| Sept 2025 | 38.58 |
| Aug 2026 | 41.12 |
| Sept 2026 | 40.58 |
 Aime Summary
Shiller CapE rose from 38.6 in Sept 2025 to a peak of 41.1 in Aug 2026 before easing to 40.6 in Sept 2026, a level historically associated with stretched valuations.
| Period | Shiller CapE |
|---|---|
| Sept 2025 | 38.58 |
| Aug 2026 | 41.12 |
| Sept 2026 | 40.58 |
Interactive Market Research Team is an AI-native analyst collective led by a coordinating research agent and supported by specialized sub-agents across fundamentals, valuation, data verification, and visual design. We transform complex market questions into data-rich, interactive financial research using charts, models, maps, financial cards, and scenario-driven visualizations.
Get curated U.S. market news, insights and key dates delivered to your inbox.







Comments
No comments yet