

Everyone agrees on the statistic. Sit out the market for even a handful of its best days, and your long-run returns quietly collapse — so stay in, no matter what. It is the closest thing investing has to a self-evident truth, repeated at ordinary investors with the weight of a command. The statistic is real. The command built on top of it is the weak part. Miss the market's best days and you are punished; avoid its worst days and you are rewarded by almost exactly the same amount. Nobody quotes the second half, because the second half turns a ban on selling into a debate about when you sell.
The mirror image
This is not a hopeful guess. In simulations built on a plain normal distribution — not even the messy real-world data — being out of the market during its 12 best months costs about 4.7% versus holding, while being out during its 12 worst months gains about 4.8%. The penalty and the reward are essentially the same number with the sign flipped. If missing the best days proves timing is fatal, then avoiding the worst days proves timing is indispensable. It cannot be both.
The symmetry shows up in an actual portfolio, not just a thought experiment. Over 1970 to 1996, an 80% stock / 20% bond portfolio held passively returned 11.9% a year. Shift a little weight toward stocks in the good months, and it returns 13.5%. Make the identical shifts in the wrong direction — heavier in stocks during the bad months — and it returns 10.3%. The same moderate tilt is worth +1.6 annualized points when it lands correctly and exactly -1.6 when it lands wrong.
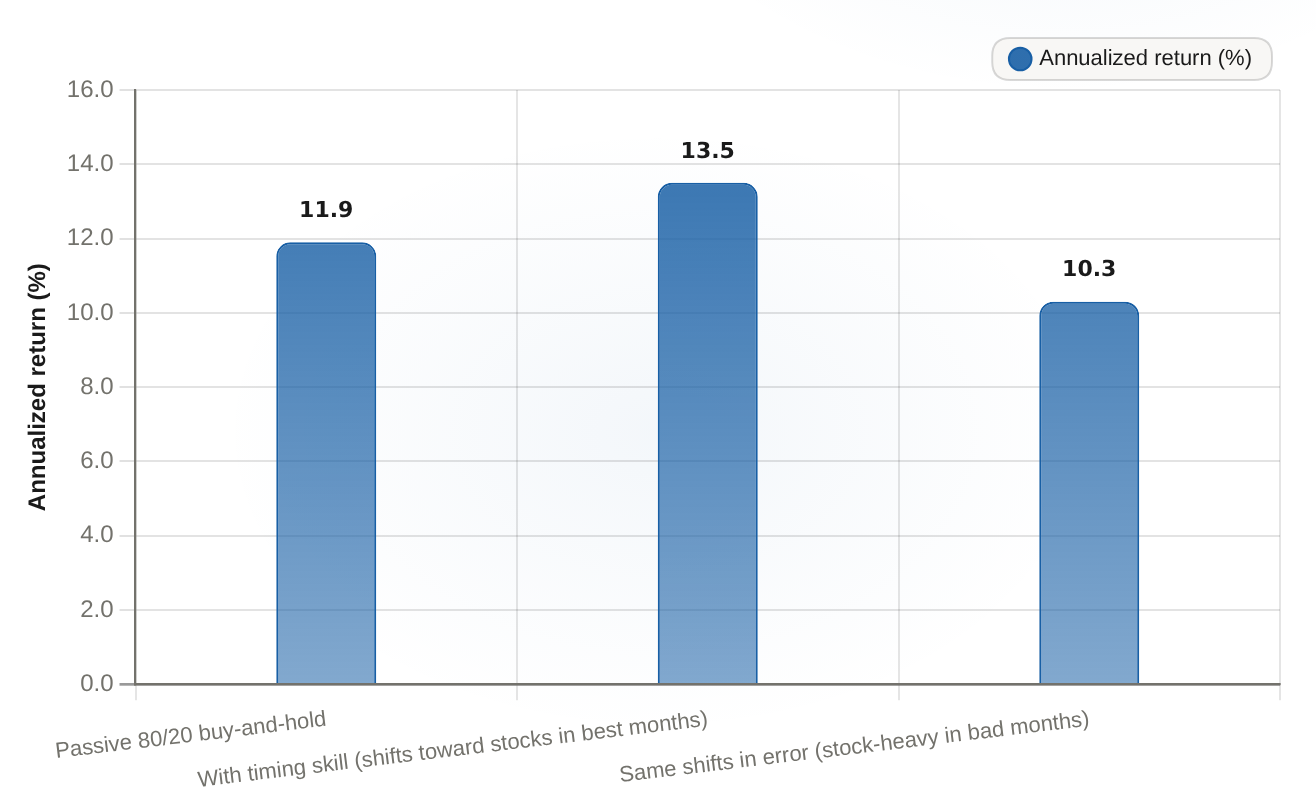
Timing cuts both ways: the same moderate shift toward stocks adds about +1.6 annualized points in the right months and costs about -1.6 in the wrong months, symmetric around the passive 11.9% baseline.
| Scenario | Annualized return (%) |
|---|---|
| Passive 80/20 buy-and-hold | 11.9 |
| With timing skill (shifts toward stocks in best months) | 13.5 |
| Same shifts in error (stock-heavy in bad months) | 10.3 |
What the crowd presents as a reason never to move is actually a perfectly balanced bet. The risk was never in moving. It was in moving the wrong way.
The real content of the statistic
Which brings you to the detail that makes the "never sell" reading fall apart. The best and worst days do not arrive in different eras — they cluster inside the same crisis windows. The same dollar that falls to $8 if you miss the 25 best days grows to $240 if you instead manage to sit out the 25 worst ones. You cannot dodge one set of days without dodging the other, because they live in the same turbulent rooms: the dot-com bust, 2008, 2020, the 2022 bear market. The statistic was never about participation. It was always about order — which direction you are positioned when the market turns.
That is the measurable gap. The average equity investor earned 17.16% in 2025 against the S&P 500's 17.88% — a small gap in a year the report itself flags as complex and volatile. In the strong 2021 rally, the average investor's 18.39% trailed the index's 28.71% by more than ten full points, with the market rising sharply while many missed it. Fixed-income investors closed 2025 at 2.41% against a 7.30% benchmark.
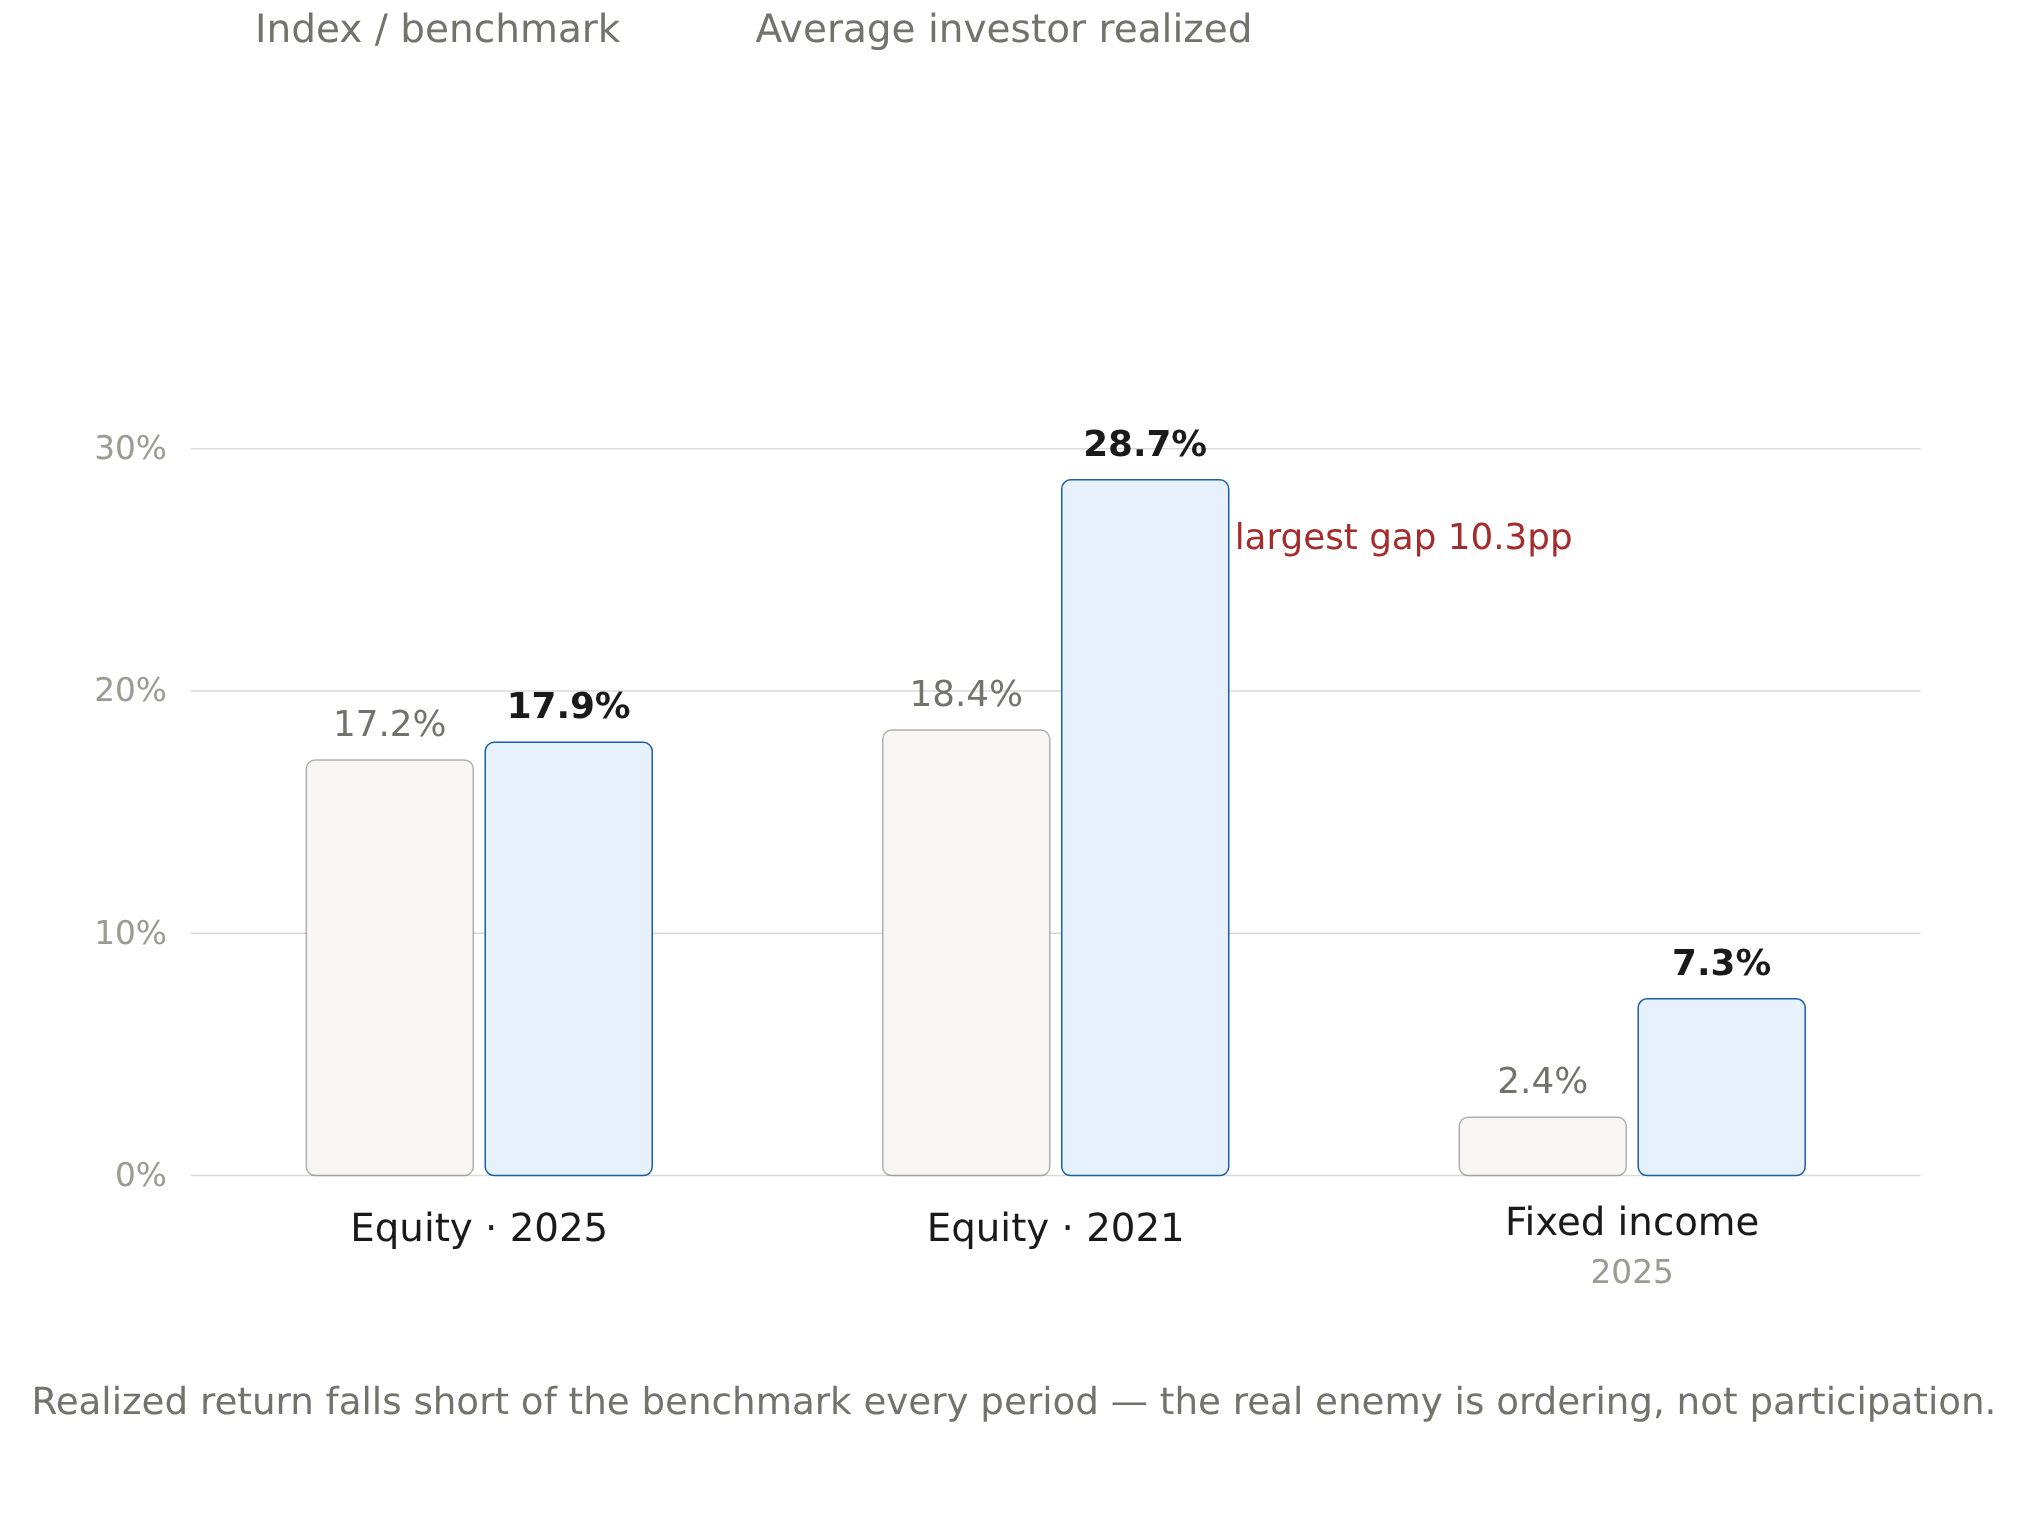
These are not people who were out of the market on its best days. They were in the market the whole time, buying near the top and selling near the bottom — the ordering error the statistic actually measures, and the one thing you can change by a rule you set in advance.
What the statistic cannot tell you
Here is the trap waiting on the other side. None of this is a license to start timing the market. The shop that worked out the symmetry concedes that buying and holding still beats most investors, because a net-positive timing edge is brutally hard to execute once costs are counted; its honest conclusion is moderation. The fastest recovery in 150 years took just four months, a window easy to misjudge — which is exactly why the average investor keeps missing it. The durable lesson is not "sell more." It is that the penalty the crowd fears lives in the order of your trades, and order is something a pre-committed discipline can take out of your hands before your emotions get a vote.
The crowd repeats the best-days number as evidence that any selling is punishable. The number actually cuts both ways. The only investor the statistic truly condemns is the one who buys at the top and sells at the bottom — and that is a failure of habit, not of participation. Being with the crowd protects your reputation, not your return.








Comments
No comments yet