
SPGI Slips 0.5%: The Hidden Pressure of Energy Shocks and Yields Weighing on Financial Data Giants
 Aime Summary
Summary
• S&P Global (SPGI) trades at 416.26, down 0.50% from yesterday's close of 418.36
• Intraday range shows volatility between a high of 420.20 and a low of 415.62
• Sector headwinds intensify as Treasury yields hit three-year highs and oil tops $100
• Market sentiment sours amid geopolitical escalation in the Middle East and inflation concerns
Macro Headwinds and Geopolitical Tensions Drive SPGISPGI-- Lower
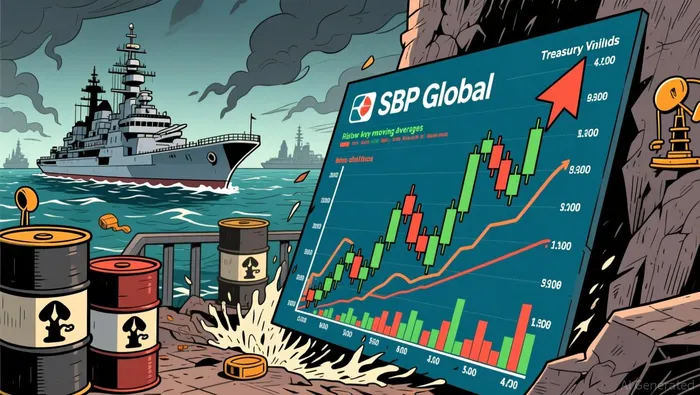
S&P Global is caught in a macroeconomic crossfire, driven by a perfect storm of rising Treasury yields and escalating geopolitical tensions. The 10-year yield surged to a three-year high of 4.85% following the Treasury Department’s announcement of a $6 billion buyback operation, which disappointed bond traders expecting larger support. Simultaneously, oil prices breached the $100-per-barrel threshold after Iran targeted U.S. Navy warships, raising fears of an energy shock that could force the Federal Reserve to raise interest rates further. This environment of rising borrowing costs and inflationary pressure is weighing heavily on financial data and stock exchange stocks like SPGI, as investors reassess valuations in a high-rate regime.
Financial Data & Stock Exchanges Under Pressure Amid Broad Market Decline
Technical Breakdown and Strategic Options Plays for SPGI
Technical indicators suggest a short-term bearish trend with the stock trading below key moving averages.
• 200-Day Moving Average: 448.20 (below)
• 100-Day Moving Average: 424.72 (below)
• RSI: 45.68 (neutral-to-weak)
• MACD Histogram: -0.80 (bearish momentum)

The stock is currently testing critical support near the 200-day moving average zone of 415.65–418.77. A break below 415.65 could accelerate losses toward the lower Bollinger Band at 408.27. With the sector leader MSCI also down 0.56%, the headwind is broad. For options traders, we identify two contracts with high leverage and favorable gamma/theta profiles for short-term volatility plays.
Top Pick 1: SPGI20260918C425SPGI20260918C425--
• Code: SPGI20260918C425 (Call)
• Expiration: 2026-09-18
• Strike Price: 425.00
• Implied Volatility Ratio: 36.44%
• Leverage Ratio: 67.86%
• Delta: 0.3812
• Theta: -1.16
• Gamma: 0.0160
• Turnover: 614
• Implied Volatility Ratio: Measures relative option pricing compared to historical volatility.
• Leverage Ratio: Indicates the percentage change in option price for every 1% move in the stock.
• Delta: Sensitivity of the option price to a $1 change in the underlying stock.
• Theta: Daily time decay of the option's value.
• Gamma: Rate of change of Delta, indicating price acceleration sensitivity.
• Turnover: Total dollar volume traded, indicating liquidity.
This contract offers a balanced risk-reward profile with high leverage (67.86x) and moderate delta (0.38), allowing for significant upside if SPGI rebounds from support. The high gamma (0.0160) means the option will gain value rapidly if the stock moves favorably, while the reasonable IV (36.44%) avoids overpaying for volatility.
Top Pick 2: SPGI20260918C422.5SPGI20260918C422.5--
• Code: SPGI20260918C422.5 (Call)
• Expiration: 2026-09-18
• Strike Price: 422.50
• Implied Volatility Ratio: 32.89%
• Leverage Ratio: 67.42%
• Delta: 0.4104
• Theta: -1.18
• Gamma: 0.0181
• Turnover: 618
• Implied Volatility Ratio: Measures relative option pricing compared to historical volatility.
• Leverage Ratio: Indicates the percentage change in option price for every 1% move in the stock.
• Delta: Sensitivity of the option price to a $1 change in the underlying stock.
• Theta: Daily time decay of the option's value.
• Gamma: Rate of change of Delta, indicating price acceleration sensitivity.
• Turnover: Total dollar volume traded, indicating liquidity.
This contract provides slightly higher gamma (0.0181) than the 425 strike, making it more responsive to short-term price swings. With a delta of 0.41, it offers a more direct exposure to stock movement while maintaining high leverage (67.42x). The low IV (32.89%) suggests it is relatively cheap relative to other strikes, offering value for traders betting on a short-term bounce.
Payoff Calculation Primer: Assuming a 5% downside scenario where SPGI drops to ~395.45, Call Option Payoff = max(0, 395.45 - K). For the 425 Call, the payoff is 0. For the 422.5 Call, the payoff is 0. This highlights the risk of buying calls in a bearish environment; these trades are best suited for a short-term rebound or if the stock holds above 415.65 support.
Aggressive bulls may consider SPGI20260918C422.5 if the stock holds above $415.65, while a break below could signal further downside to the lower Bollinger Band at $408.27.
Hold Firm or Cut Losses: Monitor $415 Support and Fed Signals
The current move in SPGI is not isolated but part of a broader market retreat driven by rising yields and geopolitical risk. While the long-term trend remains bearish, the stock is testing a critical support zone near the 200-day moving average. Investors should watch for a decisive break below $415.65, which would confirm further downside. Conversely, a hold above this level could set the stage for a technical bounce. Keep a close eye on Friday’s CPI report and any updates from the Federal Reserve regarding interest rates. Sector leader MSCI is down 0.56%, reflecting the sector-wide pressure. Watch for $415.65 breakdown or a rebound above $420 for directional clues.

TickerSnipe provides professional intraday stock analysis using technical tools to help you understand market trends and seize short-term trading opportunities.
Latest Articles
Stay ahead of the market.
Get curated U.S. market news, insights and key dates delivered to your inbox.


AInvest
PRO
AInvest
PRO




Comments
No comments yet