

On June 23, 2026, a single global selloff knocked the Nasdaq-100 down more than 3.2% for the day, with MicronMU-- off about 13%, Samsung Electronics and SK HynixSKHY-- each down about 12%, and NvidiaNVDA-- slipping 4.15%.
AI/memory names bore the June 23, 2026 selloff
One-day percent change, ranked. Broad indices held up while the crowded AI/memory complex bled far harder.
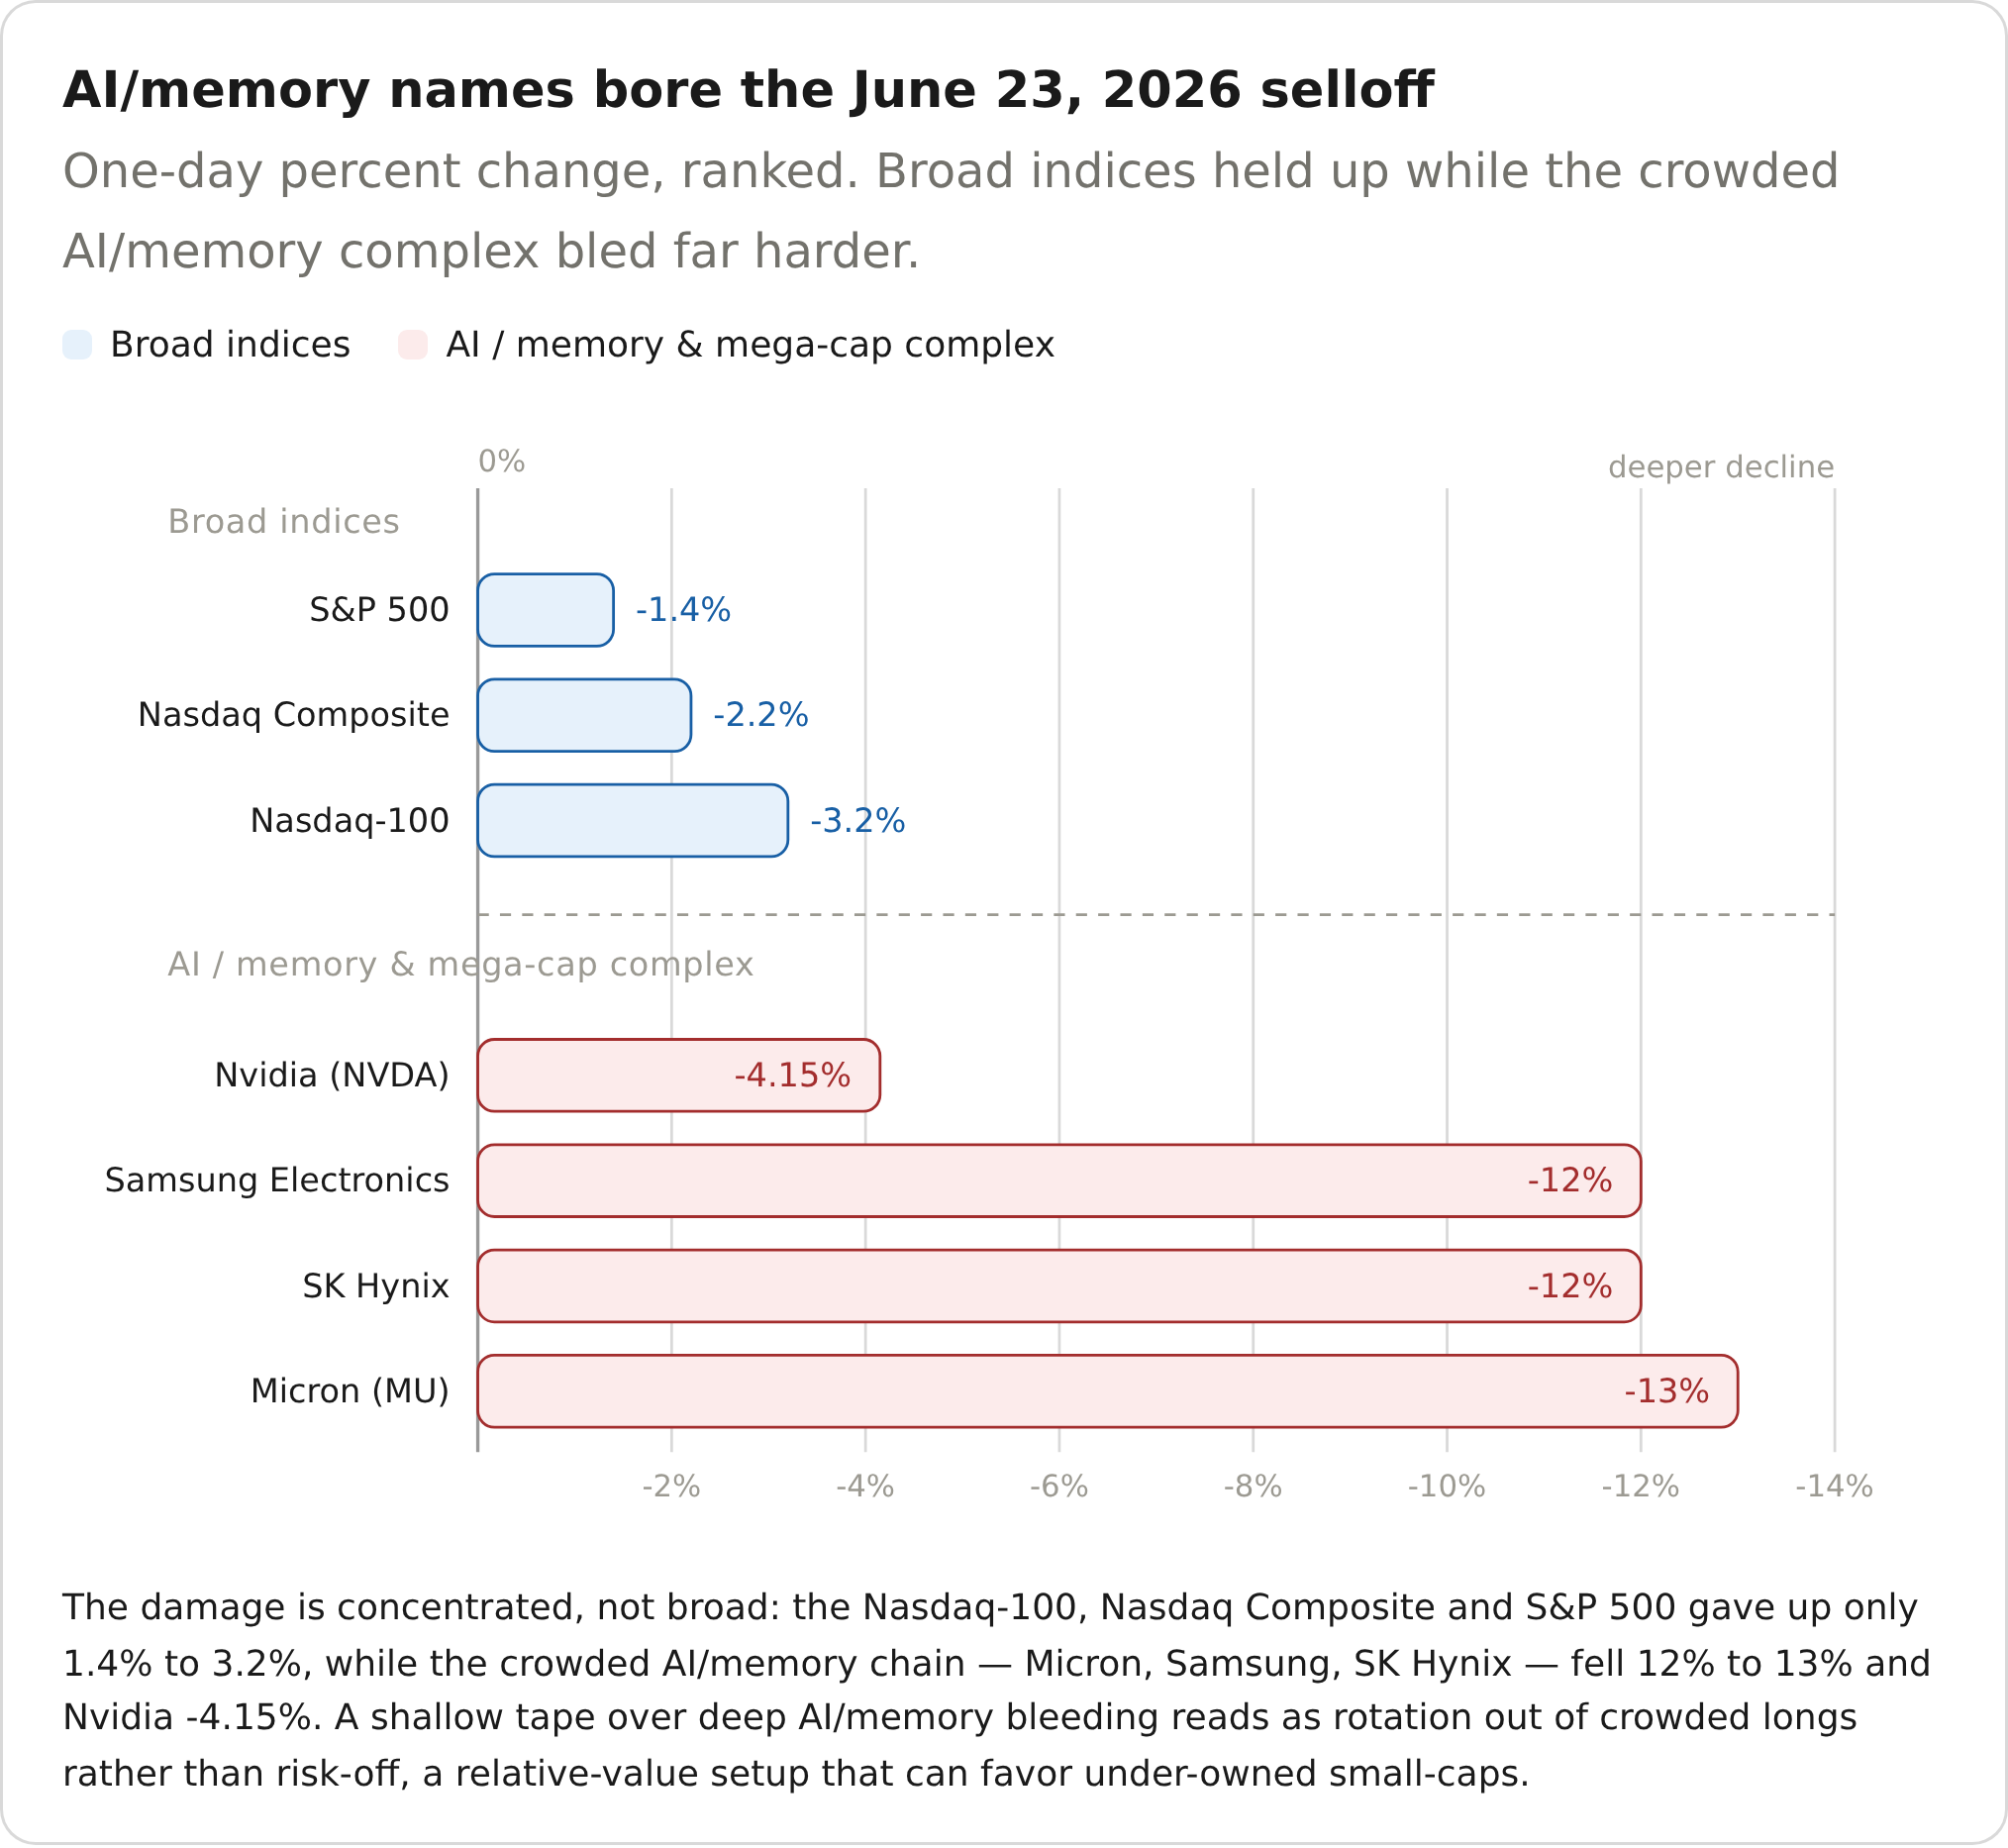
The damage is concentrated, not broad: the Nasdaq-100, Nasdaq Composite and S&P 500 gave up only 1.4% to 3.2%, while the crowded AI/memory chain — Micron, Samsung, SK Hynix — fell 12% to 13% and Nvidia -4.15%. A shallow tape over deep AI/memory bleeding reads as rotation out of crowded longs rather than risk-off, a relative-value setup that can favor under-owned small-caps.
| Metric | S&P 500 | Nasdaq Composite | Nasdaq-100 | Nvidia (NVDA) | Samsung Electronics | SK Hynix | Micron (MU) |
|---|---|---|---|---|---|---|---|
| One-day change (%) | -1.4 | -2.2 | -3.2 | -4.15 | -12.0 | -12.0 | -13.0 |
That one-day stumble matters less for its own damage than for what it exposes about how this market is built. The 10 largest stocks in the S&P 500 represented about 37.6% of the index as of July 31, 2026, a concentration above even the dot-com peak. The last time weight reached this extreme, the follow-through was a lost decade: the index compounded at about -0.95% annually from December 1999 through December 2009, turning $100,000 into roughly $90,900. Today's leaders are far more profitable than the marginal dot-com names, so history is not a script — but a market this concentrated is vulnerable whenever its front-runners stumble, and the money that owns them has to land somewhere.
The rotation into under-owned small caps is an inference, not an attested fact — but it is the right frame for reading a small-cap AI name that screens unusually right now: SoundHound AI (SOUN), the voice-AI software company.
Pull up the factor stack and it splits into two halves that rarely travel together. On the growth side, Ainvest data shows revenue up 54.6% year over year and 40% quarter over quarter in the most recent reading, on a 40.6% gross margin. On the balance sheet, SOUN carries zero net debt, roughly $202.8 million of cash, and a 391% current ratio — vault-like safety for a company this size. Then the third rail: the same data shows an operating margin of about -94.6% and free cash flow of roughly -$125.3 million over the trailing twelve months. The market prices the growth side at about 14.2x trailing sales — rich for any company, exceptionally so for one burning cash at this clip.

So where does double-digit upside come from? It sits in the analyst consensus, and it is current, not stale. As of September 2026, stockanalysis.com's 8-analyst average 12-month target is $12.71, rated Buy, and anachart's 3-analyst average is $14.00, both buy-lean reads. Measured from the recent price near $6.48, those translate to roughly +96% and +116% upside respectively. That level is a trim, not a fresh mark: Cantor Fitzgerald's Thomas Blakey had raised a target from $13 to $15 back in December 2025, citing cross-selling and voice-AI volume tied to the late-2024 Amelia acquisition — so the double-digit upside still hangs on even after analysts spoke down from that earlier ~$15 peak.
The bear case is written in the same data. A consensus target is a bet, and this one has three things working against it right now. First, dispersion: anachart's targets span from $7 to $20 across 65 observations, so a small 3- or 8-analyst average sits on a wide spread. Second, the tape will not confirm the Buy label: at about $6.48 the stock trades below both its 50-day average ($6.74) and its 200-day average ($8.21), with RSI near 43, and it is down roughly 36% year to date. Third, the operating model: a -94.6% operating margin and -$125.3 million of trailing free cash flow is not a rounding error — the growth is funded by reinvestment, not by earnings.
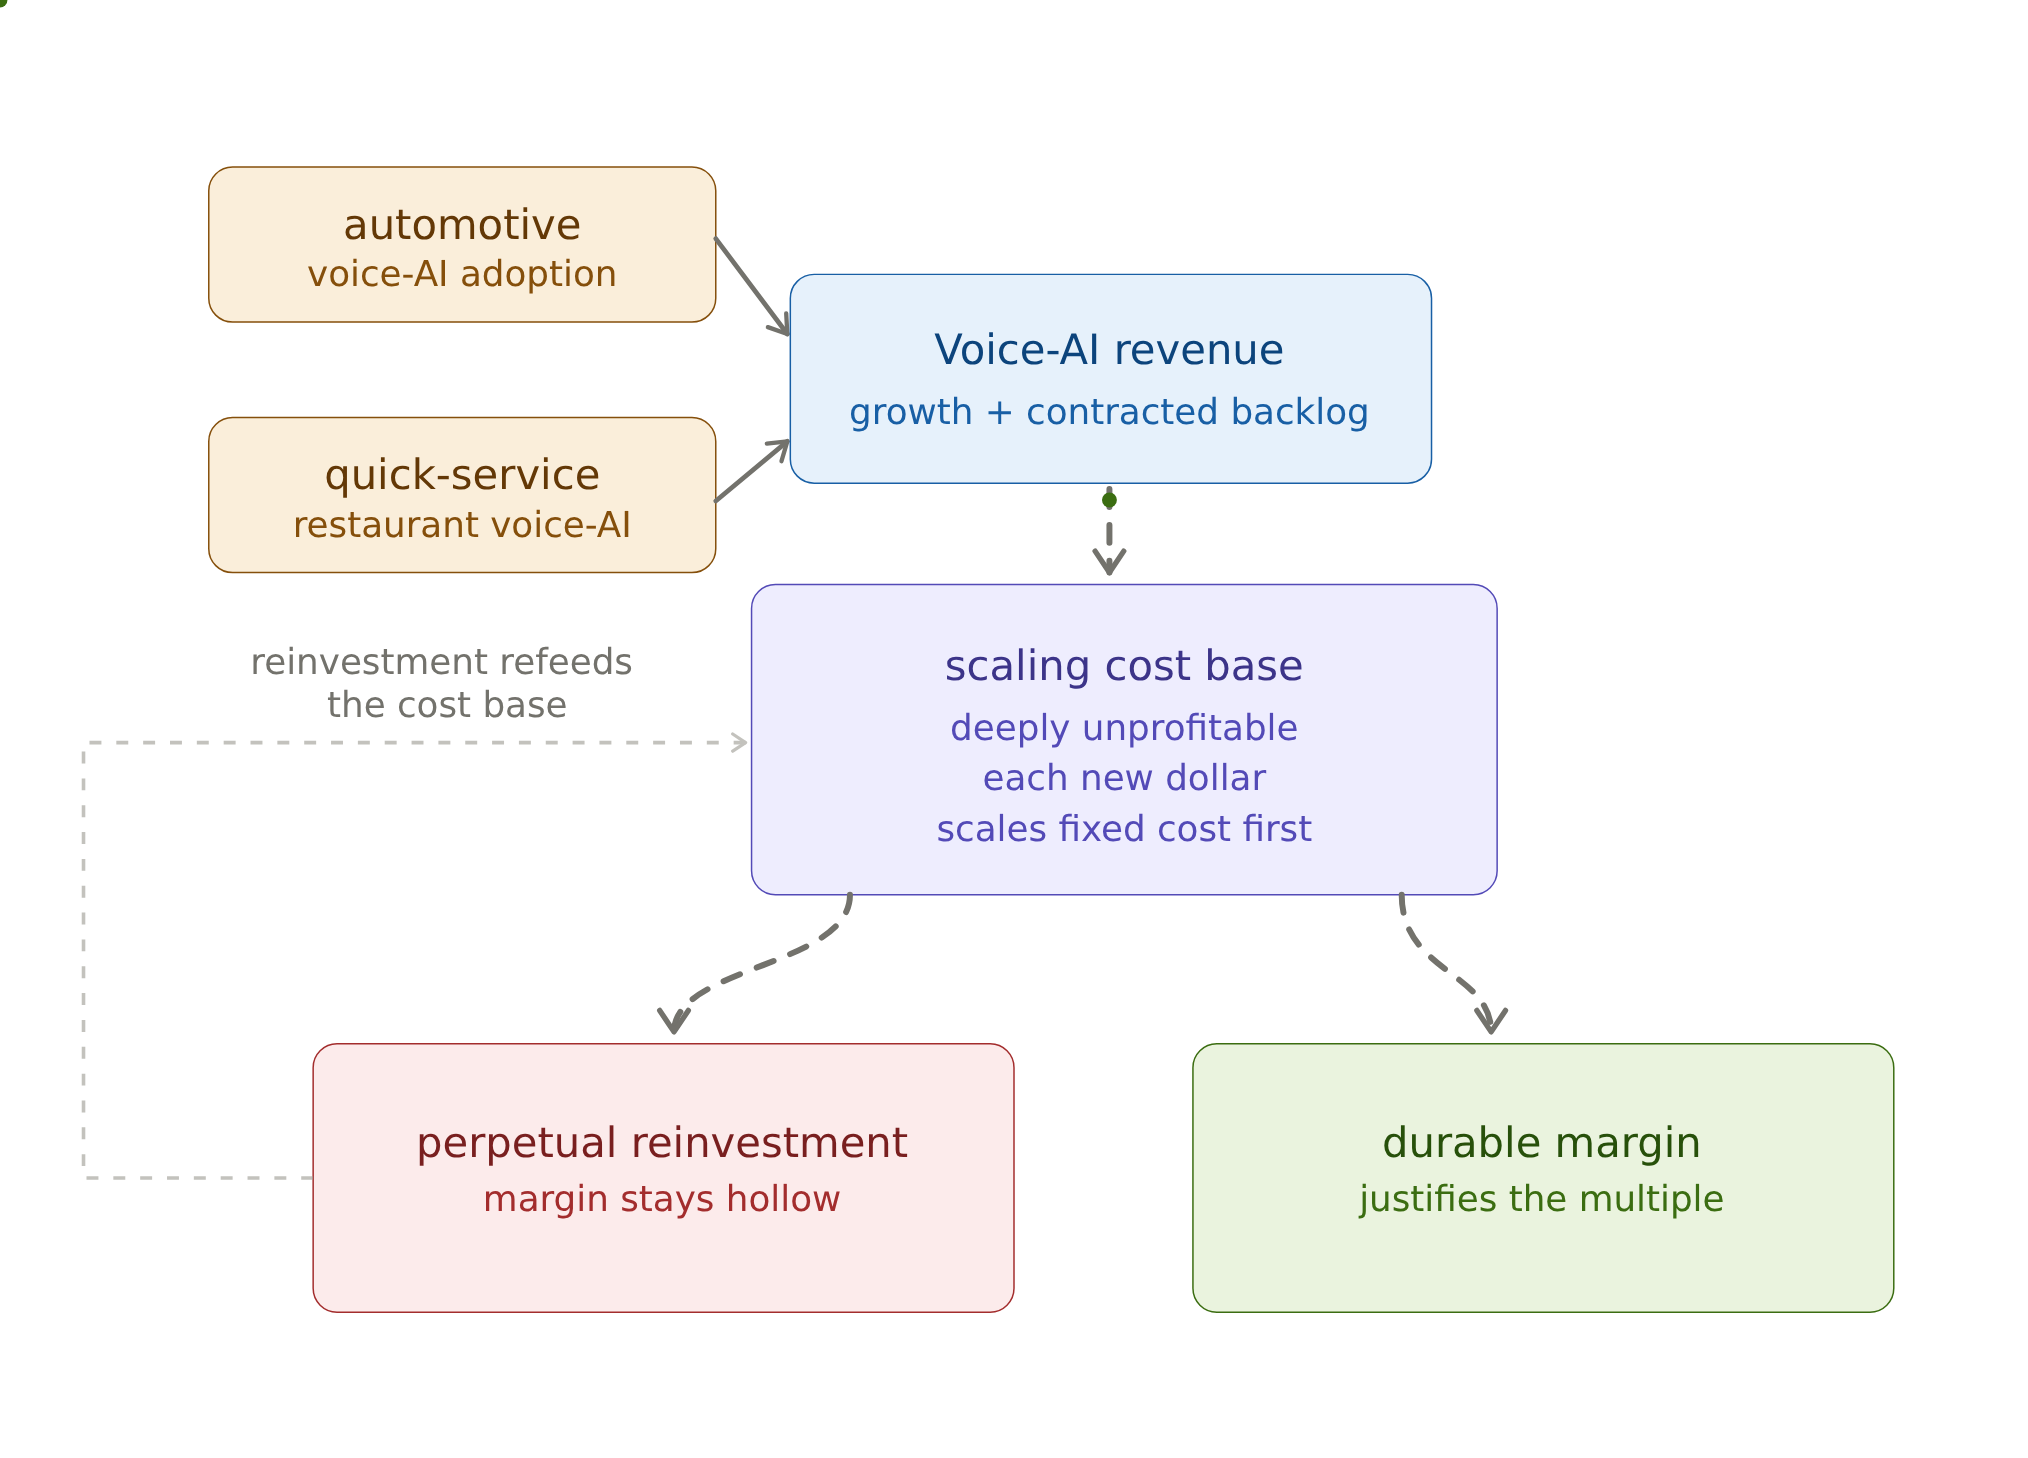
That last point is the whole game. Voice-AI adoption in automotive and restaurant order-taking is driving SOUN's revenue growth, but because the business is still deeply unprofitable, each incremental revenue dollar must first absorb a scaling cost base before any of it reaches a margin that could justify 14x sales. In plain terms, the multiple is already pricing a large future. The decision therefore hinges on margin conversion — whether that growth ever turns into durable profitability — rather than on growth itself, which is proven.
None of this makes SOUN an obviously wrong bet, and the balance sheet is the reason why: zero net debt and $202.8 million of cash buy the story time that a leveraged, cash-burning small-cap rarely has. But a near-double consensus target on a name like this is a dated bet on conversion, not a confirmed move. The two things that would change the read are reported revenue continuing to outrun consensus each quarter, and the operating margin climbing materially off that -94.6% level. If revenue misses while the margin hovers near -50% or worse, the 14x sales ratio has little underneath it and the path to the target fails. Until price reclaims the 50-day line, that +100% lives on the analyst's spreadsheet, not in the market's vote.








Comments
No comments yet