
Solo Brands Surges 15.8% — But Volume Fails to Confirm the Move
Solo Brands (NYSE: SBDS) stock news has taken center stage after a massive post-market rally pushed the stock 15.8% higher to $8.80. That’s a sharp move for a micro-cap stock with historically limited liquidity, especially without a clear catalyst in the headlines. The price surge breaks through the 20-day high of $8.63 and appears poised for a breakout, but the volume story doesn’t quite match the price action. Today’s volume was 27,320 shares, which is below the 60-day average and doesn’t strongly confirm the move. In practice, this suggests the rally is unconfirmed and could face near-term resistance before gaining broader conviction.
The stock’s intraday high of $9.17 means it closed near the upper end of the day’s range, and it’s now testing the key 60-day high of $8.90. Crucially, 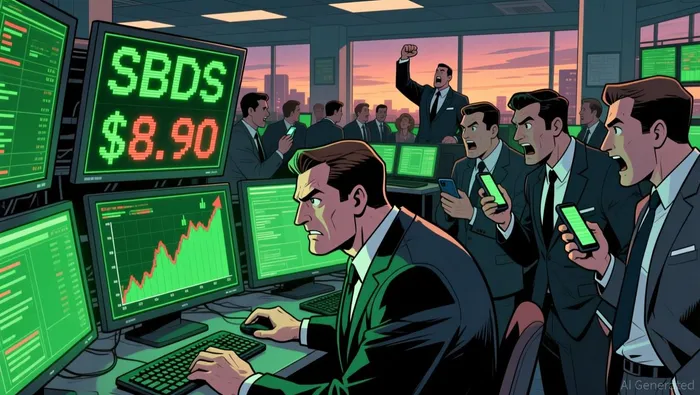 the 20-day and 50-day moving averages are at $6.96 and $6.67, respectively, showing a clear uptrend. However, the RSI at 39.67 suggests the stock isn’t overbought yet — but with the move up so fast, the metric is likely to catch up soon. Still, without a surge in volume, this could signal a structural move rather than a broad-based rally.
That said, the price action is clear: Solo BrandsSBDS-- is in a strong uptrend and testing resistance for the first time. The bottom line is the stock is breaking out — but whether it sticks depends on the next few days.
What Key Technical Levels Should Investors Watch for Solo Brands?
With Solo Brands at $8.80, the immediate price levels to watch are $8.90 and $8.00. The $8.90 level is the 60-day high and a key resistance point. If the stock holds above this level, it could signal the start of a new uptrend. On the flip side, a pullback to $8.00 — the nearest support level — could indicate a test of strength in the current rally.
In fairness, the stock has already exceeded its 20-day high of $8.63, which is a strong sign. The ATR of $0.54 also suggests the stock has a history of volatility, so a move above $8.90 or below $8.00 could happen quickly. Put differently, the stock is in a high-volatility environment, and traders should watch for any confirmation of the breakout or signs of a reversal.
Still, the 50-day moving average at $6.67 remains a long-term anchor. A return to this level would suggest the uptrend is under pressure. At the end of the day, the key levels for Solo Brands (SBDS) support and resistance are $8.90 and $8.00, with a watchful eye on the 50-day MA as a potential baseline.
What Are the Possible Scenarios for Solo Brands’ Next Moves?
Given the stock’s current position near its 60-day high and the lack of strong volume support, there are a few possible paths ahead. The most likely is a failure/reversal scenario where the stock retests the $8.00 support level before finding its footing. This is especially likely if volume doesn’t increase, as the current move is unconfirmed.
In other words, the stock could face a quick pullback — a common pattern in micro-cap stocks with thin liquidity. That said, if the stock manages to close above $8.90, it could trigger a stronger uptrend, especially if volume picks up. For now, the market is in a fragile state, and the next few days will be critical in determining the stock’s direction.
To put numbers on it, if Solo Brands breaks above $8.90 and holds it, the next resistance would be around $9.23 and $9.61 based on ATR expansion. On the other hand, if the stock falls below $8.00, it could test the $6.67–$6.96 range around the 50- and 20-day averages. Either way, traders should watch for a clear breakout or breakdown to decide their next move.
Stay ahead of the market.
Get curated U.S. market news, insights and key dates delivered to your inbox.
AInvest
PRO
AInvest
PRO
Comments
No comments yet