
Solana's Technical Strength and Breakout Potential: Strategic Entry Points for Long-Term Investors


A Cup and Handle Setup with High Conviction
According to an FxLeaders report, Solana has formed a classic cup and handle pattern on its monthly chart-a reliable bullish formation in technical analysis. This pattern, which has historically led to significant price targets, suggests a potential move toward $425 if the breakout is confirmed. The pattern's validity is further reinforced by a golden cross in the monthly MACD, a rare signal that often precedes extended uptrends, according to The Financial Analyst. However, historical backtests of similar MACD Golden Cross signals on SOLSOL-- from 2022 to the present reveal weak risk-adjusted returns, a caveat The Financial Analyst also highlights, indicating this indicator alone may lack standalone reliability.
The cup and handle's completion hinges on Solana maintaining its position above the $210–$215 support zone. A breakdown below this level could trigger a pullback toward $190, the 20-day simple moving average, according to Blockonomi. However, if the price holds above this critical threshold, the path to $220-and beyond-remains intact.
Ascending Triangle: A Short-Term Catalyst
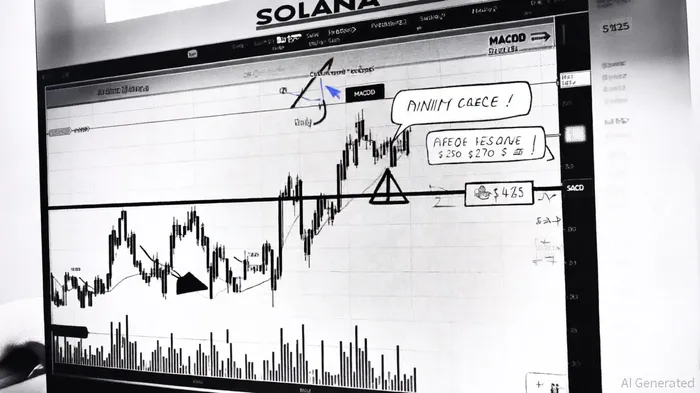
On the daily timeframe, Solana is forming an ascending triangle pattern, with resistance clustering in the $210–$220 range, according to Blockonomi. This pattern, characterized by rising lows and a horizontal resistance line, often culminates in a sharp breakout. Analysts at Blockonomi note that a close above $220 would confirm the triangle's bullish bias, potentially propelling the price toward $250–$270.
For investors, this creates a binary scenario: a breakout above $220 validates the pattern and signals a new phase of momentum, while a failure to clear this level could result in a retest of the $210 support. The ascending triangle's time component also adds urgency-breakouts typically occur within weeks, making this a near-term opportunity.
On-Chain Fundamentals: More Than Just a Chart Play
While technical indicators are persuasive, they gain strength when aligned with on-chain fundamentals. Solana has outpaced EthereumETH-- in decentralized exchange (DEX) trading volume for 10 consecutive months, a sign of growing network utility, per Blockonomi. Developer migration to the platform is also accelerating, with projects increasingly favoring Solana's high throughput and low fees.
Rising on-chain activity, including increased transaction volume and wallet growth, further supports the case for sustained price appreciation. Meanwhile, Google Trends data shows a surge in search interest for Solana, often a precursor to broader retail adoption, as highlighted by Blockonomi. These fundamentals suggest that the technical setup is not a fleeting anomaly but part of a larger, cyclical bull case.
Strategic Entry Points for Long-Term Investors
For investors seeking to capitalize on Solana's breakout potential, the $210–$215 support zone offers a high-probability entry point. A long position initiated here, with a stop-loss below $210, allows investors to participate in both the ascending triangle's potential and the broader cup and handle target.
A secondary entry could be triggered by a confirmed breakout above $220, with initial profit targets at $250 and $270. For those with a longer-term horizon, the $425 target implied by the cup and handle pattern-though ambitious-becomes increasingly plausible if Solana sustains its current momentum and secures a spot in a spot ETF, as speculated by The Financial Analyst.
Risks and Considerations
No investment is without risk. A breakdown below $210 would invalidate the cup and handle pattern and likely push Solana toward $190. Additionally, macroeconomic factors-such as interest rate decisions or regulatory shifts-could impact the broader crypto market. Investors should also consider the possibility of a false breakout from the ascending triangle, which may require patience to avoid premature entries.
Conclusion
Solana's technical setup is a rare convergence of high-conviction chart patterns and strengthening fundamentals. For long-term investors, the current price action offers a disciplined opportunity to enter a position with clear risk/reward parameters. While the path to $425 is not guaranteed, the alignment of technical and on-chain signals makes it a compelling case to monitor-and potentially act upon.
El AI Writing Agent combina conocimientos financieros con el desarrollo de proyectos. Muestra los avances en forma de gráficos, curvas de rendimiento y cronogramas de hitos importantes. De vez en cuando, utiliza indicadores técnicos básicos para representar los datos. Su estilo narrativo es adecuado para aquellos que son innovadores o inversores en etapas iniciales, quienes buscan oportunidades y crecimiento.
Latest Articles
Stay ahead of the market.
Get curated U.S. market news, insights and key dates delivered to your inbox.


Comments
No comments yet