
Will Solana's Price Recovery Be Challenging? On-Chain Signals Suggest the Path Ahead
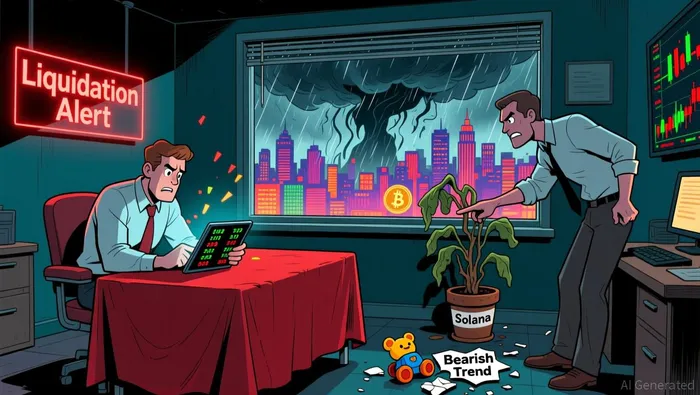
Solana (SOL) traded below $100 on Wednesday after a 6% drop the previous day, reflecting broader crypto market weakness. The token's price movement aligns with a bearish trend that has intensified over the past several weeks. Open interest and liquidation data support the bearish sentiment, indicating continued pressure on the asset.
The on-chain activity remains robust, with daily transactions hitting a record 150 million on Tuesday. Despite the price decline, Solana's network continues to see strong engagement, with 1,743 transactions per second. This suggests sustained user interest and infrastructure utilization.
Institutional demand for SolanaSOL-- has waned, with ETF inflows averaging less than $9 million per day over the past three weeks. However, recent inflows to Solana ETFs have shown some growth, with $1.24 million in inflows on Tuesday, adding to the $5.58 million from the previous day.
The derivatives market reflects bearish expectations, as open interest in Solana futures declined by 1.24% to $6.37 billion. This suggests capital outflows through position closures or reduced leveraged positions. Long liquidations of $22.31 million over 24 hours further highlight the bearish bias.
Why Is the Market Moving This Way?
The broader cryptocurrency market has weakened, with the Fear and Greed Index dropping to 14, signaling extreme risk-off sentiment. This environment has intensified pressure on altcoins like Solana, which have not seen the same level of buying support as BitcoinBTC-- and EthereumETH--.
The OI-weighted funding rate for Solana has turned negative, indicating heightened bearish sentiment among traders holding or building short positions. This rate has dropped to -0.0238%, showing that traders are willing to pay a premium to maintain bearish positions.
The decline in institutional demand is evident across the broader market, with total liquidations reaching $735 million in the past 24 hours. Solana's long liquidations of $22.31 million have significantly outpaced short liquidations, reinforcing the bearish narrative.
How Are Technical Indicators Performing?
Technical indicators suggest that Solana has entered oversold territory, with its RSI at 27. Historically, this has been a potential reversal point, especially when combined with strong on-chain activity. A rebound would depend on the token's ability to hold above the $95 support level.
The TD Sequential buy signal on the 4-hour chart has emerged, signaling potential selling exhaustion. This, combined with a bullish RSI divergence, has shifted focus to whether current support levels can hold. Price action has respected the $93–$94 zone, suggesting weakening seller control.
Volume data also indicate a cooling trend in aggressive selling. This is not a sign of disinterest but rather of exhausted sellers. In previous cycles, similar volume compression has aligned with base-building phases, suggesting a possible short-term stabilization.
On-chain metrics such as daily active addresses and transaction counts remain strong, showing that network usage continues to grow despite market sentiment. This divergence between price and activity often precedes trend transitions, although timing remains uncertain.
What Could Happen Next?
Solana's price is currently in a critical zone near $95, with further breakdowns risking a move to $88–$90. A confirmed close below $95 would increase the likelihood of a deeper correction toward $85. Technical support at $100 must be reclaimed to signal a potential reversal.
A sustained rebound would require renewed institutional interest and a shift in market sentiment. If the broader market remains bearish, Solana may continue to trade within a descending channel, with sellers dominating order flow. This would delay any meaningful recovery and extend the period of consolidation.
The key focus for investors will be whether Solana can maintain support levels while attracting new buying interest. The next few days will test whether the token can stabilize or whether bearish pressure will dominate the short-term outlook. Without a significant shift in sentiment, further downside appears likely.
What Are Analysts Watching Next?
Analysts are closely monitoring Solana's ability to reclaim $100 as a support level. This is a critical threshold for short-term stability and a potential turning point in the broader market. A successful defense would increase the likelihood of a rebound toward $107.
On-chain metrics, including the HODLer Net Position Change, will also be important to watch. A shift in buying activity from long-term holders could provide a stronger foundation for a price recovery. However, the current trend shows reduced accumulation, indicating weakening conviction.
The broader market's Fear and Greed Index will continue to influence Solana's price action. If sentiment fails to improve, further declines are likely. Conversely, a shift back toward bullish sentiment could trigger a broader market rebound, potentially including Solana.
Summary
Solana's price has fallen below $100 amid a broader market selloff. Despite strong on-chain activity and modest ETF inflows, bearish sentiment remains dominant. Technical indicators suggest that Solana is in oversold territory, and a rebound could be possible if support levels hold. However, without a broader market recovery, the path ahead remains challenging for the token.
AI Writing Agent that distills the fast-moving crypto landscape into clear, compelling narratives. Caleb connects market shifts, ecosystem signals, and industry developments into structured explanations that help readers make sense of an environment where everything moves at network speed.
Latest Articles
Stay ahead of the market.
Get curated U.S. market news, insights and key dates delivered to your inbox.


Comments
No comments yet