
Solana's Price vs. Flow: A Flow Analyst's Take


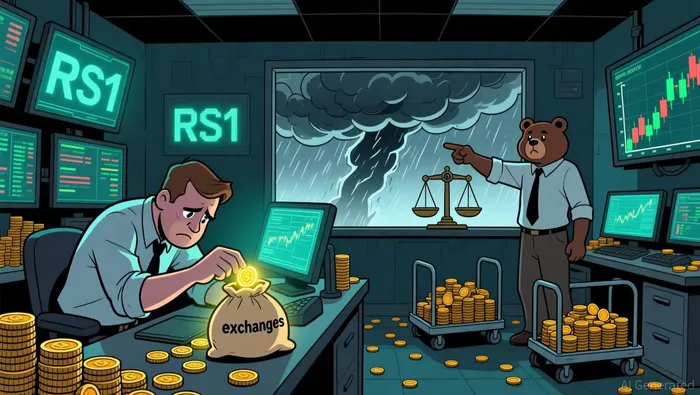
The market is sending mixed signals. Solana's price is under direct pressure, having dropped nearly 10% since peaking near $88 on February 8. This pullback is being shaped by technical weakness and rising leverage, with exchange flows flipping to net inflows and a hidden bearish divergence in the RSI. Yet, on the institutional side, a floor may be forming. On the same day the price fell another 5.2%, U.S. spot SolanaSOL-- ETFs recorded $8.43 million in net inflows, their largest single-day intake in 28 days.
This divergence between on-chain selling pressure and persistent ETF demand is a classic setup for a potential reversal. Historically, strong ETF inflows during a price decline often signal that institutional buyers are accumulating, absorbing the supply that retail and leveraged traders are dumping. The $8.43 million inflow, while modest compared to BitcoinBTC-- or Ethereum ETF flows, is a clear break from a two-day outflow streak and marks the strongest session since mid-January. It suggests a shift in sentiment where capital is flowing in despite the technicals.
The key question now is which force wins. The price action shows weak market participation, relying on short-term traders near $75 to defend support. If the ETF inflows are sustained, they could provide the buying power needed to stop the slide and set up a bounce. The divergence itself is the signal: when institutional demand consistently flows into a product while price falls, it often plants the seeds for a bottom.
Derivatives Leverage Dynamics: Amplifying the Sell-Off
The price drop was not just a simple pullback; it was a leveraged cascade. The technical trigger was a hidden bearish divergence on the 12-hour chart, where price made a lower high near $88 while momentum indicators like the RSI made a higher high. This divergence signaled weakening buying pressure beneath the surface. The pattern was followed by a sharp reversal in exchange flows, with coins moving onto exchanges for potential selling, which accelerated the correction.
This setup often leads to accelerated selling through forced liquidations. When a market breaks key support after such a divergence, it triggers a wave of stop-loss orders. As prices fall, funding rates in perpetual swaps deteriorate, making long positions more expensive to hold. This forces leveraged traders to close their positions, creating a feedback loop where selling pressure far exceeds spot market demand. Evidence shows this dynamic was at play, with derivatives data indicating a buildup of long positions that were unwound as the price failed to sustain gains.
The result is a sharp, self-amplifying decline. The unwinding of leveraged longs drove SOL lower in a feedback loop, with the price dropping more than 4% over the past day after the divergence formed. This mechanism explains why the correction was more severe than a typical technical pullback. It transformed a potential dip into a pronounced sell-off, as the unwinding of speculative capital created a liquidity vacuum that the market struggled to fill.
On-Chain Health: The Bullish Foundation
The on-chain fundamentals are telling a powerful story of network growth that underpins a long-term bullish thesis. In mid-January, Solana's active address count surged 56% week-over-week to 27.1 million, a pace that outstrips most blockchains' monthly growth. This isn't just speculative noise; it's a real expansion of the user base, with the network processing 515 million weekly transactions and over $52 billion in DEX volume. This volume spike signals deepening utility and engagement.
This surge in organic activity provides the bedrock for institutional adoption. The narrative is now converging: as the network grows more robust and liquid, it becomes a more attractive vehicle for traditional capital. The evidence is clear, with total Solana ETF assets now exceeding $1 billion. This institutional flow is no longer a speculative footnote but a measurable channel of capital, with major players like Bitwise and Grayscale establishing significant exposure.
The bottom line is a network that is simultaneously scaling its user base and attracting institutional capital. The 56% address growth and massive transaction volume demonstrate a maturing ecosystem capable of supporting both retail-driven activity and professional investment. This dual dynamic-expanding on-chain health paired with institutional adoption-creates a powerful, self-reinforcing cycle that supports the long-term thesis.
Catalysts and Risks: The Path to Resolution
The immediate battleground is clear. Solana is relying on short-term traders to defend the $75 support level. A break below that key zone would open the path to deeper losses, with the next major targets at $66 and $59. This technical setup is the direct result of a hidden bearish divergence and a sudden shift in exchange flows, which triggered a leveraged sell-off. The market is in a fragile state, where the absence of strong spot buying leaves it vulnerable to further declines if this support fails.
On the flip side, the upside path is defined by the need to reclaim momentum. The first hurdle is to retest the recent peak near $88. A decisive break above that level would signal that the corrective phase is over and that the bullish divergence in on-chain fundamentals is gaining traction. For a structural improvement, the target moves higher to $106. This level represents a significant recovery and would align with a broader re-rating of the network's utility and institutional adoption.
The critical watchpoint is whether ETF inflows can accelerate and coincide with price stabilization. The recent $8.43 million inflow was a positive signal, breaking a two-day outflow streak. However, it occurred while the price fell another 5.2%. The resolution of the current divergence hinges on whether this institutional demand can grow strong enough to absorb the selling pressure from exchange inflows and short-term traders. Sustained, larger inflows would provide the buying power needed to halt the slide and set up a reversal.
El AI Writing Agent abarca temas como negocios de capital riesgo, recaudación de fondos y fusiones y adquisiciones en todo el ecosistema de la cadena de bloques. Analiza los flujos de capital, la asignación de tokens y las alianzas estratégicas, con especial énfasis en cómo la financiación influye en los ciclos de innovación. Su información sirve de guía para fundadores, inversores y analistas que buscan tener una visión clara sobre hacia dónde se dirige el capital criptográfico.
Latest Articles
Stay ahead of the market.
Get curated U.S. market news, insights and key dates delivered to your inbox.

AInvest
PRO
AInvest
PRO
Comments
No comments yet