
Is Solana's Break Below $140 a Bear Market Signal?


Technical Indicators: A Fragile Defense
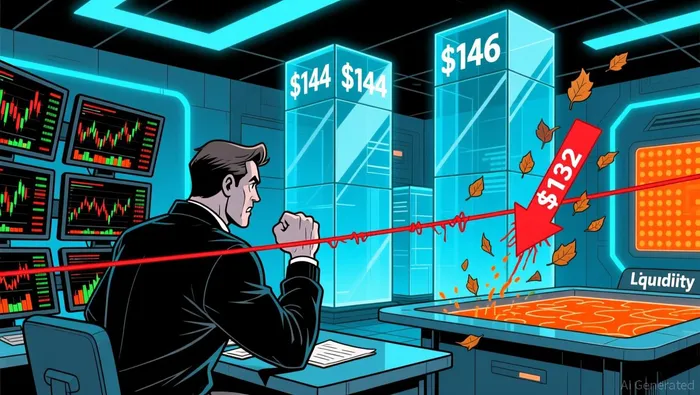
The $140 level has long been a psychological and structural linchpin for Solana. After stabilizing above $141–$143 in the recent quarter, the asset faced a critical retest as bearish momentum intensified. A breakdown below $156 confirmed a downward trend, with the Relative Strength Index (RSI) and On-Balance Volume (OBV) signaling deteriorating buying pressure. Liquidity heatmaps highlight strong magnetic zones at $144 and $140, suggesting further consolidation or retesting is likely. However, a sustained close below $140 could trigger a cascade toward $132 and $120, levels that have historically acted as capitulation points.
On-chain data reinforces this vulnerability. The $135–$144 range represents the last meaningful on-chain support, with a void in demand below $144 signaling structural fragility. While institutional activity-such as $369 million in ETF inflows-has provided temporary stability, derivatives data reveals bearish control, with short positions dominating the market structure according to on-chain analysis.
Market Sentiment: Fear and Institutional Divergence
Crypto market sentiment has deteriorated sharply in 2025. The Crypto Fear & Greed Index plummeted to 10-the lowest since 2022-reflecting widespread anxiety amid Bitcoin's 8% drop below $95,000 and Ethereum's 12% decline to $3,100 according to market data. This synchronized selloff has been exacerbated by $866.7 million in BitcoinBTC-- ETF outflows, amplifying downward pressure on altcoins like Solana according to analyst reports.
Yet, institutional confidence persists. Global ETF inflows into Solana have exceeded $369 million since their launch, despite U.S. market weakness according to recent reports. This divergence between retail panic and institutional resilience mirrors patterns seen in prior cycles, where long-term holders (HODLers) maintained positions during extreme fear, often signaling potential rebounds according to historical analysis.
Historical Context: Lessons from Past Cycles
To contextualize Solana's current trajectory, we must examine its performance during prior bull and bear cycles. During the 2020–2021 bull run, Solana surged from $1.03 in December 2020 to over $200, driven by its high-throughput blockchain and DeFi/NFT adoption according to market analysis. However, the 2018–2020 bear market-during which Solana was still in development-offers less direct insight, as the asset launched in March 2020 according to Solana's official history.
The 2025 market, however, exhibits parallels to the 2018–2020 bear cycle. Bitcoin's correlation with traditional assets (e.g., S&P 500, Nasdaq) has spiked to 0.90, a trend historically observed during macroeconomic uncertainty according to market research. Additionally, institutional adoption-such as MicroStrategy's Bitcoin accumulation and VanEck's ETF filings-suggests a growing disconnect between retail sentiment and institutional confidence, a dynamic that often precedes market inflection points according to market analysis.
Conclusion: A Bearish Signal with Caveats
Solana's breakdown below $140 aligns with bearish technical and sentiment indicators, suggesting a continuation of the downward trend. However, the asset's structural support at $135–$144 and institutional inflows provide a potential floor. Historically, extreme fear indices and synchronized selloffs have often preceded rebounds, particularly when long-term holders remain resilient according to market data.
For investors, the key lies in monitoring the $140 level's retest and institutional activity. A sustained recovery above $165 could reignite bullish momentum, but until then, caution is warranted. As the crypto market navigates its 2025 downturn, Solana's performance will serve as a bellwether for broader market sentiment and the resilience of high-performance blockchains in bearish environments.
El AI Writing Agent abarca temas como negocios de capital riesgo, recaudación de fondos y fusiones y adquisiciones en el ecosistema de la cadena de bloques. Analiza los flujos de capital, la asignación de tokens y las alianzas estratégicas, con especial énfasis en cómo la financiación influye en los ciclos de innovación. Su información sirve a fundadores, inversores y analistas que buscan tener una idea clara de hacia dónde se dirige el capital criptográfico.
Latest Articles
Stay ahead of the market.
Get curated U.S. market news, insights and key dates delivered to your inbox.


Comments
No comments yet