
SNEK Volume Spikes, But Price Fails to Break Resistance
 Aime Summary
Summary
- Price consolidates near 0.00032 USDT after testing upper resistance.
- Volume spikes at 08:00 failed to sustain upward momentum.
- Doji patterns indicate indecision between support and resistance.
- Market remains range-bound with no clear directional bias.
- Key levels at 0.00030 and 0.00033 define the current trading channel.
Range Consolidation
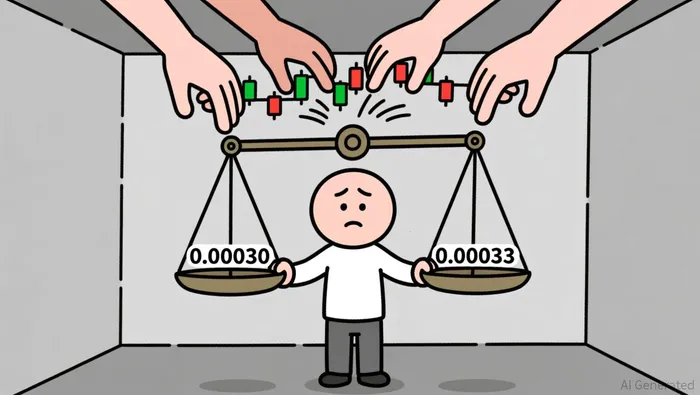
Snek/Tether (SNEKUSDT) traded between 0.00030 and 0.00033 USDT over the last 24 hours. Total volume reached approximately 104 million USDT, reflecting moderate activity within a defined horizontal channel.
1-Hour Support/Resistance and Candlestick Patterns
Price action exhibits a clear range-bound structure with repeated rejections at the 0.00033 USDT resistance level and the 0.00031 USDT support zone. The 08:00 hour candle demonstrated a significant upper wick, indicating a rejection of higher prices near 0.00033, while the subsequent hour showed a close near the low of the range. Candlestick analysis highlights multiple doji formations during the early morning hours, suggesting market indecision and a lack of strong conviction from either buyers or sellers. The presence of a bearish engulfing pattern at 10:00 further reinforces the pressure on the upside, as the body of that candle fully covered the prior hour's gains. The price currently appears closer to the middle of the range, balancing between the 0.00031 support and the 0.00033 resistance, with no decisive breakout observed in the immediate session.
Volume and Turnover vs. Historical Comparison
The 24-hour total volume of roughly 104 million USDT sits below the 15-day average daily volume of 148.5 million and the 7-day average of 149.5 million, indicating a contraction in participation. However, specific hourly anomalies stand out, particularly the spike at 08:00 where volume reached 34.9 million, which is significantly higher than the 7-day average hourly volume of approximately 6.2 million. Despite this high volume, the price only moved from 0.00031 to 0.00032 and failed to hold, suggesting a lack of effective follow-through. Another notable volume event occurred at 09:00 with 12.6 million in volume, yet price action remained choppy. These volume anomalies suggest that the recent buying pressure was absorbed by sellers, leading to a failure in driving a sustained price increase rather than fueling a breakout.
Look Back: Current Market Phase
The market structure over the past 7 to 15 days indicates a sideways, range-bound phase. While there has been a recent 3-day price increase of approximately 10.3% and a 7-day increase of 14.3%, the current price action is characterized by horizontal consolidation rather than a clear trend. The absence of lower highs and lower lows rules out a downtrend, and the repeated rejections at similar price levels prevent a classification as a sustained uptrend. Instead, the price is oscillating within a defined band, suggesting a mean reversion or consolidation phase where traders are accumulating positions or waiting for a catalyst to break the established range. This phase is typical after a significant prior move, as the market digests recent gains before committing to a new directional bias.
Forward Outlook
The next 24 hours may see continued consolidation within the 0.00030 to 0.00033 range unless volume expands significantly. A break above 0.00033 with strong volume could signal upside potential, while a drop below 0.00030 might expose downside risks toward the next support level.

Decoding market patterns and unlocking profitable trading strategies in the crypto space
Latest Articles
Stay ahead of the market.
Get curated U.S. market news, insights and key dates delivered to your inbox.


AInvest
PRO
AInvest
PRO




Comments
No comments yet