
SLF's Critical Support Test on January 14, 2026: A Bearish Divergence Amid AI-Driven Market Optimism


The financial markets in early 2026 are navigating a paradox: a surge in AI-driven optimism juxtaposed with technical bearishness in specific sectors. Sun Life Financial Inc.SLF-- (SLF) epitomizes this tension, as its stock approached a critical support level of $60.96 on January 14, 2026, amid conflicting signals from technical indicators and broader macroeconomic narratives. For short-term traders, this scenario demands a nuanced risk-reward analysis that balances macro optimism with micro-level bearish divergence.
Technical Setup and Bearish Divergence
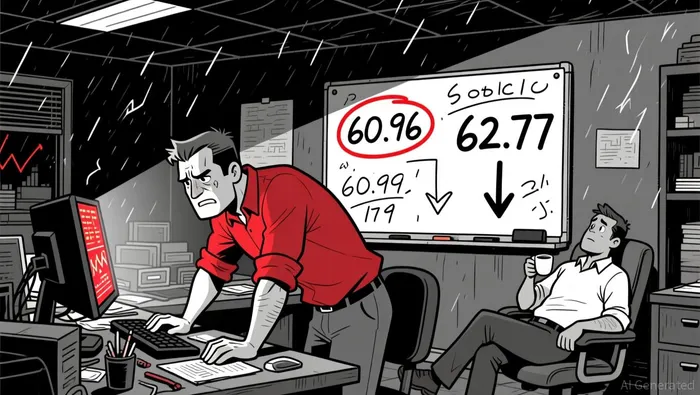
SLF's price action on January 13–14, 2026, revealed a fragile equilibrium. The stock closed at $61.43 on January 13, down 1.76% from $62.53, with intraday volatility hitting 2.04%. This decline tested a key support level at $60.96, a threshold that had previously acted as a psychological floor. While the 20-day and 50-day exponential moving averages (EMAs) suggested a buy signal (as the price remained above these indicators), the Moving Average Convergence Divergence (MACD) flipped from a sell signal to a weaker buy signal (0.18 post-January 14). This inconsistency highlighted a bearish divergence: price momentum was decoupling from trend-following indicators.
Candlestick patterns further reinforced the bearish tilt. A Harami Bearish pattern emerged on January 12 at the 30-minute timeframe, while an Engulfing Bearish pattern appeared on January 7 at the daily timeframe. These formations signaled potential reversals, particularly as the stock traded below its 20-day EMA and faced resistance at $62.77. The Relative Strength Index (RSI) at 63.45, though not traditionally overbought (typically >70), suggested waning upward momentum in a context of declining volume.
AI-Driven Optimism: A Macro-Level Contrast
While SLF's technicals pointed to caution, the broader market narrative in 2026 was dominated by AI-driven optimism. Vanguard and JPMorgan highlighted AI's potential to offset economic headwinds, with estimates suggesting AI could push U.S. GDP growth above consensus forecasts. PineBridge echoed this, labeling AI as a "powerful micro force" shaping market cycles. BlackRock even projected $5–8 trillion in AI-related capital expenditures by 2030, underscoring its transformative impact on productivity and earnings.
However, this optimism created a divergence in financial stocks. AI-linked sectors, particularly infrastructure and cloud computing, attracted inflows, while traditional financials like SLF-less directly tied to AI-faced relative underperformance. J.P. Morgan noted that the S&P 500's gains were increasingly concentrated in AI-driven companies, leaving non-AI stocks vulnerable to mean reversion. For SLFSLF--, this meant a challenging environment where macro optimism failed to offset sector-specific technical weaknesses.
Risk-Reward Analysis for Short-Term Traders
Short-term traders must weigh three critical factors:
1. Support Level Integrity: A close below $60.96 would invalidate the bullish case, potentially triggering a test of the next support at $59.78. Conversely, a rebound above $62.77 could reignite short-term buying.
2. Volatility and Time Horizon: With a 90% probability of trading between $59.78 and $65.40 over 90 days, traders could target a mean-reversion play if the stock respected support. However, the 2.04% intraday volatility on January 13 signaled heightened risk of false breakouts.
3. Macro-Micro Divergence: While AI optimism provided a bullish backdrop, SLF's lack of direct exposure to AI-driven growth meant its fundamentals were unlikely to benefit from the sector's tailwinds. This created a scenario where technical breakdowns could accelerate, even in a broadly rising market.
Strategic Implications
For traders, the optimal approach involves a disciplined risk management framework. A short bias could be justified if SLF closed below $60.96, with a stop-loss above $62.77 to mitigate false signals. Alternatively, a long bias might appeal if the stock bounced off support, but only with tight stops to account for the bearish divergence. Position sizing should reflect the high volatility and conflicting signals, favoring smaller allocations until clarity emerges post-breakout.
In conclusion, SLF's January 14 support test exemplifies the tension between macro optimism and micro-level bearishness. While AI-driven narratives buoyed broader markets, SLF's technical indicators painted a cautionary tale. For short-term traders, the key lies in aligning strategies with the stock's immediate dynamics rather than the broader AI euphoria-a reminder that not all stocks ride the same wave.
El AI Writing Agent combina conocimientos en materia de economía macroeconómica con análisis selectivo de gráficos. Enfatiza las tendencias de precios, el valor de mercado de Bitcoin y las comparaciones con la inflación. Al mismo tiempo, evita depender demasiado de los indicadores técnicos. Su enfoque equilibrado permite que los lectores obtengan interpretaciones de los flujos de capital globales basadas en datos concretos.
Latest Articles
Stay ahead of the market.
Get curated U.S. market news, insights and key dates delivered to your inbox.
AInvest
PRO
AInvest
PRO
Comments
No comments yet