
SIREN Surges Amid AI Narrative But Faces Liquidity and Volatility Risks
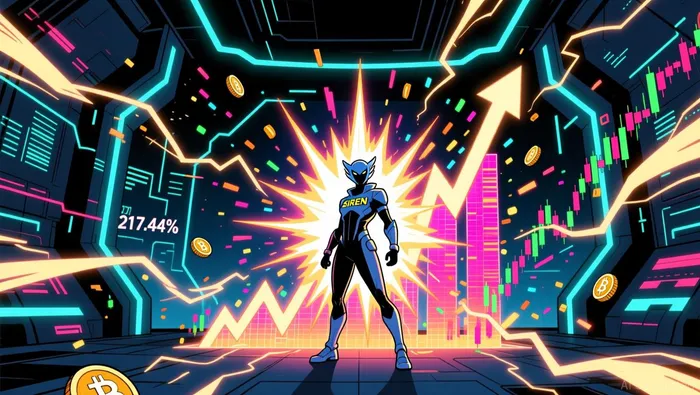
SIREN surged 217.44% in 24 hours to $0.49343, with $181.66M in trading volume against a $351.24M market cap according to analysis. The token's volume-to-market-cap ratio of 51.7% signals potential volatility or buying pressure, while the intraday price range spanned $0.13232 to $0.582508 as reported. Analysts highlight liquidity issues and manipulation risks due to SIREN's circulating supply of 72.8% of max supply according to analysis.
SIREN's recent volatility reflects intense speculative activity. The token surged 217.44% in 24 hours, reaching $0.49343. This surge occurred alongside significant trading volume—$181.66 million—against a market cap of $351.24 million. The high volume-to-market-cap ratio of 51.7% suggests potential volatility according to data, exceeding the typical 10-30% range for sustainable assets. Intraday trading ranged from $0.13232 to $0.582508, a 340% spread, raising concerns about whale activity or coordinated trading as reported.
The token's recent performance indicates structural issues. Despite a 217.44% surge in 24 hours, SIREN remains down 70% over seven days and 85.2% below its all-time high of $3.61 according to analysis. Analysts warn of risks from low on-chain activity and concentrated ownership according to reports. The token's circulating supply of 72.8% suggests liquidity issues and manipulation risks according to data.
The broader market context is marked by mixed signals. SIREN's volume-to-market-cap ratio of 63% indicates extraordinary activity, with gains across 60+ trading pairs according to MEXC. However, the token's market cap of $447 million places it at rank #102, attracting institutional attention. Historical data shows that 73% of tokens with similar drawdowns never recover within 50% of their peak according to analysis.
Why Is SIREN's Price So Volatile?
SIREN's price volatility is driven by speculative trading and liquidity issues. The token surged 217.44% in 24 hours, but it has lost 70% over seven days and 85.2% from its all-time high according to reports. This pattern suggests volatility-driven mean reversion rather than sustainable recovery. The volume-to-market-cap ratio of 35.7% indicates forced liquidation and short-covering dynamics according to analysis.
The intraday price range of $0.132 to $0.269 represents a 103.5% spread, confirming wild volatility according to data. SIREN's 92.8% decline from its March 22, 2026, all-time high of $3.61 indicates deep structural damage. The token would need to rally 1,309% to revisit its ATH, a recovery profile seen in less than 2% of tokens following similar drawdowns according to analysis.
The token's circulating supply of 728.2 million tokens against a maximum supply of 1 billion eliminates supply overhang as a primary explanation according to data. This suggests demand-side capitulation or protocol-specific concerns. The liquidity profile presents substantial execution challenges, with a $5 million market buy likely pushing prices 15-20% according to reports.
What Are the Key Market Indicators for SIREN?
Market indicators for SIREN include volume-to-market-cap ratios, price ranges, and on-chain activity. The token's volume-to-market-cap ratio of 51.7% indicates potential volatility or buying pressure according to analysis. Intraday price ranges have shown significant volatility, with a 340% spread from $0.13232 to $0.582508 as reported. These metrics highlight the token's susceptibility to manipulation and liquidity issues.
The token's performance against BitcoinBTC-- and other major pairs suggests coordinated buying pressure rather than isolated arbitrage according to data. SIREN's 145% gain against the US dollar and nearly identical 144.59% gain against Bitcoin indicates the rally was not riding Bitcoin's coattails according to analysis. The consistent performance across major trading pairs suggests genuine demand.
The token's market cap of $447 million places it at rank #102, attracting institutional attention. Historical data shows that 68% of tokens with similar volume spikes experience additional 30-50% gains in 48 hours, followed by 40-60% corrections according to reports. The absence of fundamental catalysts raises concerns about the sustainability of the rally.
What Is the Outlook for SIREN's Future Price?
The outlook for SIREN's future price is uncertain due to volatility and lack of fundamental catalysts. The token's 29.9% price drop in 24 hours, accompanied by an 800% surge in trading volume, indicates potential liquidity issues according to analysis. The price is now 94.45% below its all-time high of $3.61, suggesting structural market failure or coordinated deleveraging according to reports.
The token's 30-day performance shows a 49.14% decline, indicating the deterioration began well before the recent acceleration according to data. The intraday price range from $0.187979 to $0.293203 reflects a 55.9% volatility band, extraordinary by crypto standards. The surge in trading volume to $38.48 million suggests scenarios such as a distribution event by large holders, forced liquidations on lending platforms, or market maker withdrawal according to analysis.
The token has obliterated every meaningful support level during its March rally, and the current price is 658.44% above the all-time low set in March 2025. The fully diluted valuation (FDV) equals the market cap, implying all tokens are in the market according to reports. However, 27.2% of the max supply remains unissued, raising concerns about future inflation risk. The broader context places SIREN among the worst performers in the mid-cap crypto space for 2026 according to data.
The decline's magnitude and speed suggest idiosyncratic project-specific issues rather than general market weakness. Investors should be cautious about key risk factors for bottom-fishing, including the absence of fundamental catalysts and the improbability of recovery without new capital according to analysis. The article advises investors to monitor volume normalization, support stability, and on-chain holder distribution to assess the token's future.
SIREN's price rebound is driven by technical factors rather than fresh fundamentals . The price bounced from a strong demand zone near $0.40–$0.45, where buyers stepped in aggressively, visible through a spike in volume. The broader market environment still favors high-volatility altcoins, particularly those tied to AI narratives. SIREN is benefiting from this positioning. The oversold conditions triggered a relief rally, with RSI recovering from oversold levels (~30) to neutral (~50) .
However, SIREN’s price structure remains clearly bearish on the short-term frame, with the token forming lower highs and lows and experiencing strong rejection candles after topping near $3. This confirms a distribution phase followed by a downtrend. The current move does not appear to be the start of a new trend but a temporary bounce before another leg down . Key levels to watch include immediate resistance at $0.60–$0.65, major resistance at $0.80–$1.00, and a trend reversal zone above $1.50. A breakout above $0.65 could extend the rally toward $0.80–$1.00, while a rejection near $0.55–$0.6 could activate the lower target at $0.45–$0.3 .
Blending traditional trading wisdom with cutting-edge cryptocurrency insights.
Latest Articles
Stay ahead of the market.
Get curated U.S. market news, insights and key dates delivered to your inbox.


AInvest
PRO
AInvest
PRO
Comments
No comments yet