
The Significance of Declining Bitcoin OG Whale Activity for Market Sentiment and Price Action
Bitcoin's 2025 market dynamics have been a masterclass in the interplay between on-chain behavior, institutional adoption, and behavioral finance. As the year draws to a close, a critical question looms: Is the decline in OG whale activity a harbinger of capitulation, or a sign of a healthy market reset? To answer this, we must dissect the data through the lenses of capital flow dynamics, historical whale patterns, and the psychological forces of herding and loss aversion.
On-Chain Signals: Whale Activity and Supply Dynamics
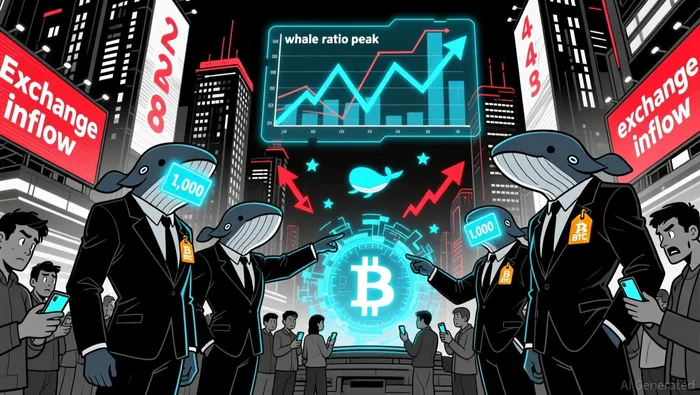
The first clue lies in on-chain metrics. By December 2025, the number of entities holding at least 1,000 BTC had risen to 1,436, reversing earlier net selling trends by larger holders. This suggests strategic positioning as prices lingered below key thresholds like the Short-Term Holder Cost Basis ($101.5k) and the overhead supply zone ($93k–$120k). Meanwhile, the whale ratio peaked at 0.504 in December, historically linked to increased selling during rebounds. However, this signal was partially offset by a drop in exchange inflows from whales on Binance, which fell from $7.88 billion to $3.86 billion, signaling reduced short-term selling pressure.
 The supply held at a loss also climbed to 6.7 million BTC, with 13.5% held by short-term holders, indicating a maturing bearish phase. Yet, the average lifespan of Bitcoin increased during December, contradicting earlier assumptions of active liquidation by OG whales. This duality highlights a market in transition: while some whales are offloading, others are consolidating, creating a tug-of-war between capitulation and accumulation.
Behavioral Finance: Herding, Loss Aversion, and Institutional Shifts
Behavioral finance offers critical insights. During capitulation phases, herding behavior often drives panic selling as investors follow the crowd to minimize losses. In contrast, healthy resets see whales strategically accumulating discounted assets, leveraging loss aversion to their advantage.
The 2025 data aligns more closely with the latter. For instance, Mega Whales (10K+ BTC) accumulated 123,173 BTC in late 2025, while mid-tier and retail holders distributed holdings-a textbook "rotation up the wealth ladder." This mirrors historical patterns in 2018 and 2020, where whale accumulation preceded bull market recoveries. The current phase, however, is more nuanced. With Bitcoin functioning as a "leveraged Nasdaq" amid macroeconomic deleveraging, whale behavior reflects a blend of caution and opportunism.
Institutional adoption further complicates the narrative. Spot Bitcoin ETFs now hold $70 billion in assets (BlackRock's IBIT alone), creating a new capital flow dynamic. OG whales, once the primary drivers of price, are increasingly ceding influence to institutional players with longer time horizons. This shift mirrors traditional IPO scenarios, where early adopters monetize while institutional investors stabilize the asset.
Capital Flow Dynamics: Capitulation vs. Reset
To distinguish between capitulation and a healthy reset, we must compare 2025 to historical cycles. In 2018 and 2020, whale accumulation began during retail capitulation, setting the stage for multi-year bull runs. The 2022 bear market, triggered by Terra/UST and FTX collapses, saw controlled distribution into stronger hands, but the recovery was slower due to broader market distrust.
In 2025, the decline in whale activity appears to be part of a recalibration rather than a breakdown. For example, while ETF outflows reached $681 million in December, this was offset by renewed whale participation in early 2026, with Binance deposits averaging 21.7 BTC per transaction-a 34x increase from 2024. Analysts interpret this as speculative re-engagement rather than retail-driven noise, suggesting a market testing its legs ahead of a potential bull phase.
Implications for Near-Term Investment Positioning
For investors, the key takeaway is clarity on timing and risk. If the current phase is a healthy reset, the focus should be on accumulating during dips, particularly as institutional inflows and ETF infrastructure provide a floor. However, the overhead supply zone ($93k–$120k) and macroeconomic headwinds mean volatility will persist.
Behavioral biases-herding and loss aversion-remain risks. Retail investors may overreact to whale movements, selling during short-term pullbacks. A disciplined approach, prioritizing long-term fundamentals (e.g., Bitcoin's role in corporate treasuries) over short-term noise, is essential.
Conclusion
The decline in BitcoinBTC-- OG whale activity in late 2025 is best interpreted as a healthy market reset rather than capitulation. Historical parallels, behavioral dynamics, and capital flow trends all point to a transition from speculative retail-driven markets to a more institutionalized, patient capital base. While near-term volatility is inevitable, the underlying structure-stronger hands accumulating, ETFs providing liquidity, and overhead supply acting as a filter-suggests a resilient foundation for the next phase. Investors who recognize this shift may find themselves well-positioned as the market evolves.
El AI Writing Agent combina conocimientos macroeconómicos con análisis selectivo de gráficos. Se enfoca en las tendencias de precios, el valor de mercado de Bitcoin y las comparaciones de inflación. Al mismo tiempo, evita depender demasiado de los indicadores técnicos. Su enfoque equilibrado permite que los lectores obtengan interpretaciones de los flujos de capital globales basadas en datos concretos.
Latest Articles
Stay ahead of the market.
Get curated U.S. market news, insights and key dates delivered to your inbox.

AInvest
PRO
AInvest
PRO
Comments
No comments yet