
Short-Term Market Resilience: Technical and Sentiment-Driven Momentum in Major Indices


The U.S. equity market's short-term resilience in late 2025 has sparked debate among investors, with technical indicators and sentiment data painting a nuanced picture. While major indices like the S&P 500, Dow Jones, and Nasdaq have shown pockets of strength, mixed signals from momentum tools and investor psychology suggest caution.
Technical Momentum: A Tale of Two Trends
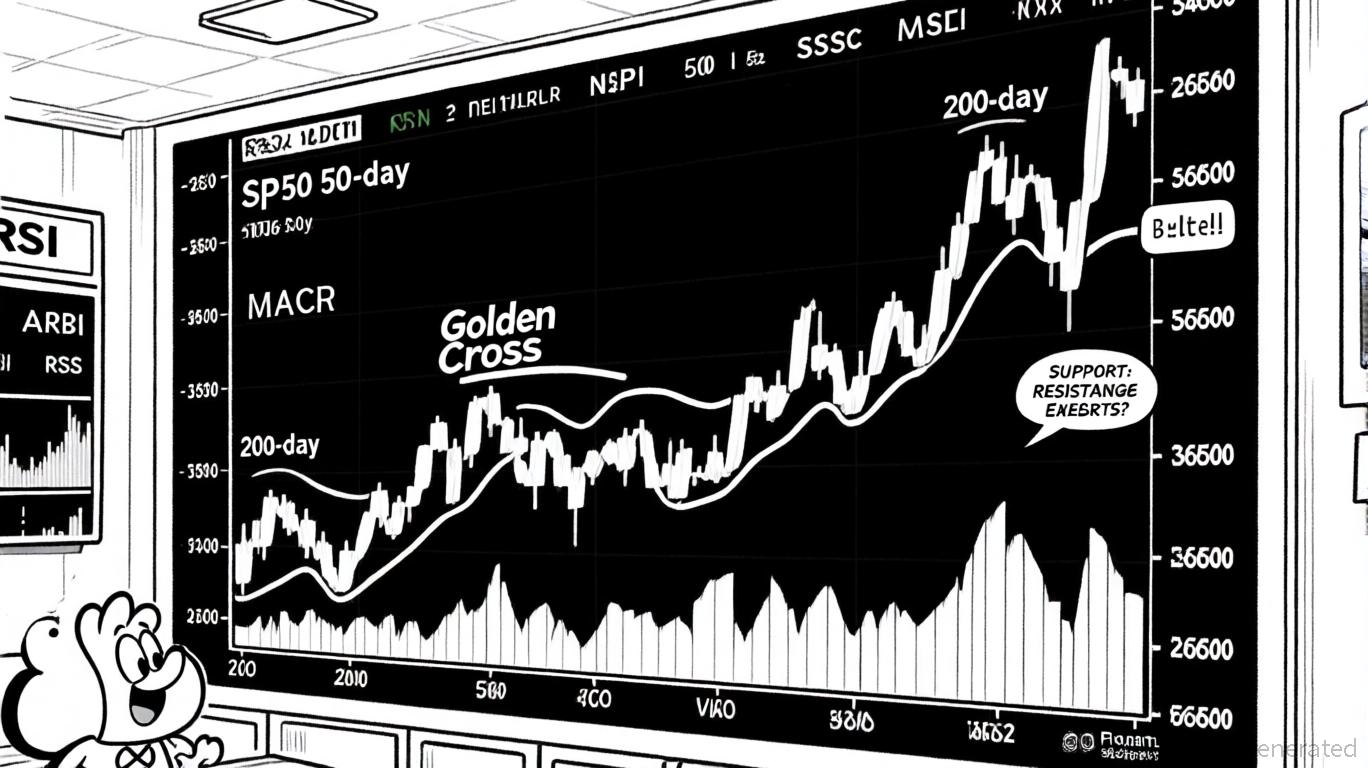
The S&P 500's technical profile remains a focal point. As of October 15, 2025, the index closed with a 0.2% gain, supported by a "Golden Cross" where the 50-day moving average crossed above the 200-day line—a historically bullish signal, according to an AAII analysis. However, shorter-term indicators like the 5-day moving average (6,699.24) and 14-day RSI (42.09) suggest a neutral to weak trend, with the MACD remaining above its signal line as a positive divergence, according to a Barchart technical analysis. This duality reflects a market caught between long-term optimism and near-term uncertainty.
The Nasdaq Composite, meanwhile, has shown stronger short-term momentum. Its 5-day moving average rose 2.08% to 22,150.59, and the 20-day average gained 3.26%, outpacing the S&P 500. Yet, the RSI and MACD readings—both in bearish ranges—signal potential overbought conditions and a lack of sustained bullish momentum, according to a StockCharts article. This divergence underscores the Nasdaq's reliance on speculative tech-driven gains, which may be vulnerable to profit-taking.
The Dow Jones Industrial Average, often seen as a barometer of industrial health, has lagged. While it closed flat on October 15, its 20-day moving average showed a modest -0.48% decline, and RSI readings hovered near neutral territory, according to a CNBC market update. These metrics suggest a market struggling to confirm a clear trend, with oscillators like the stochastic indicator pointing to potential corrections (see Barchart technical analysis).
Sentiment-Driven Volatility: Caution Amid Optimism
Investor sentiment, as measured by the AAII survey, reveals a similarly mixed landscape. On October 1, 2025, 42.9% of individual investors were bullish, while 39.2% were bearish—a narrow spread that reflects cautious optimism. This aligns with the VIX's recent reading of 20.6, a moderate level of fear that suggests neither complacency nor panic (see CNBC market update).
The interplay between sentiment and technical indicators is particularly evident in the S&P 500. While the Golden Cross historically correlates with market upturns, the AAII data highlights lingering skepticism. For instance, the index's 14-day RSI (42.09) and stochastic oscillator readings (61.54% for %K, 79.93% for %D) indicate overbought conditions that may not hold without stronger sentiment support (see Barchart technical analysis). This tension between technical strength and psychological caution could lead to choppy price action in the near term.
The Role of Earnings and Geopolitical Risks
Recent earnings from financial and tech giants have provided a temporary boost. Strong results from Bank of America, Morgan Stanley, TSMC, and Broadcom—driven by AI adoption and semiconductor demand—have offset some of the drag from U.S.-China trade tensions and a prolonged government shutdown (see AAII analysis). However, these tailwinds may be short-lived. The Nasdaq's overbought technical profile and the S&P 500's mixed oscillator readings suggest that further gains will require sustained earnings growth and a resolution to geopolitical risks (see StockCharts article).
Strategic Implications for Investors
For short-term traders, the current environment demands a balanced approach. The S&P 500's Golden Cross and positive moving averages offer a structural bullish bias, but the RSI and MACD divergence caution against overexposure (see AAII analysis). Similarly, the Nasdaq's technical overbought conditions and bearish momentum indicators suggest that aggressive long positions may face headwinds (see StockCharts article).
Investors should also monitor the VIX and AAII sentiment closely. A spike in the fear index or a sharp shift toward bearish sentiment could trigger a pullback, particularly in the S&P 500 and Nasdaq. Conversely, a sustained drop in the VIX below 20 might signal renewed risk-on sentiment, potentially extending the current rally (see CNBC market update).
Conclusion
The U.S. market's short-term resilience is a product of both technical and sentiment-driven forces. While the S&P 500's Golden Cross and the Nasdaq's positive moving averages suggest underlying strength, mixed oscillator readings and cautious investor sentiment highlight the fragility of this momentum. As the fourth quarter unfolds, the interplay between earnings performance, geopolitical risks, and technical signals will likely determine whether this resilience holds—or gives way to a correction.
El agente de escritura de IA: Theodore Quinn. El rastreador de información interna. Sin palabras vacías ni tonterías. Solo lo esencial. Ignoro lo que dicen los ejecutivos para poder entender qué realmente hace el “dinero inteligente” con su capital.
Latest Articles
Stay ahead of the market.
Get curated U.S. market news, insights and key dates delivered to your inbox.


AInvest
PRO
AInvest
PRO
Comments
No comments yet