
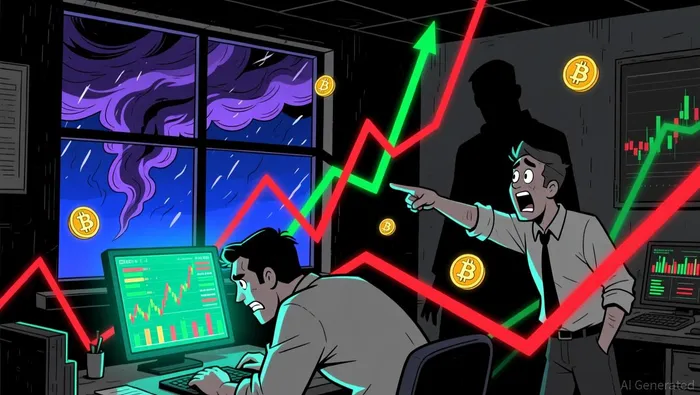
Shiba Inu (SHIB) on the Brink of a Breakout: Technical and Sentiment Analysis for 2025


Shiba Inu (SHIB), the memecoinMEME-- that has captivated retail investors since its 2020 launch, is once again at a critical juncture. With its price hovering near key historical levels in late 2025, the interplay of technical indicators, on-chain metrics, and market sentiment suggests a potential breakout scenario. This analysis synthesizes historical price patterns, recent volatility, and supply-side dynamics to evaluate SHIB's prospects.
Historical Price Patterns and Key Levels
SHIB's price trajectory from 2023 to 2025 has been marked by extreme volatility. In 2023, the token traded between $0.0000056 and $0.0000156, consolidating around $0.0000103 by year-end. The following year saw a sharp peak of $0.0000453 in 2024, followed by a decline to $0.0000212, reflecting speculative fervor and subsequent profit-taking. By 2025, SHIB's range narrowed further, with a high of $0.0000249 and a low of $0.0000070 according to historical data.
Recent November 2025 data reveals a critical consolidation phase. On November 10, SHIBSHIB-- traded at $0.00001000, only to dip to $0.00000800 by November 25 according to Yahoo Finance. This 20% decline within two weeks highlights the token's sensitivity to market sentiment. However, a weekly high of $0.00000952 on November 10-a 26% rebound from mid-November lows-suggests potential for a bullish reversal according to analysis. Analysts have drawn parallels to SHIB's 2020 performance, noting that prolonged bearish cycles often precede sharp recoveries.
Technical Indicators and Resistance Levels
Technical analysis underscores SHIB's positioning near pivotal support and resistance levels. In 2024, technical indicators indicated a sideways trend within a horizontal channel. If this pattern persists, SHIB could test resistance levels of $0.00004113 and $0.00023184, or retest support at $0.00001706 and $0.00000735 according to price prediction models.
As of late 2025, SHIB's average price of $0.000008 aligns with its 2025 low, suggesting a potential floor for further declines according to market analysis. The Fear & Greed Index, which gauges market psychology, recorded an extreme fear score of 23 in 2025-a level historically associated with oversold conditions according to market data. This, combined with bullish divergence patterns observed in late November, has led some analysts to predict a 234% rally if SHIB breaks above $0.00000952 according to recent analysis.
Sentiment and On-Chain Metrics
Sentiment analysis reveals a mixed picture. While SHIB's burn rate-a metric tracking token destruction-surged 217% in a 24-hour period in late 2025, the price failed to immediately respond according to market reports. This disconnect between supply-side improvements and price action underscores the token's reliance on broader market trends.
On-chain data further complicates the outlook. Trading volume declined sharply in 2025, with a notable absence of large "whale" wallet activity. Despite this, the project's ecosystem continues to evolve, including plans to restart the Shibarium bridge, a Layer-2 solution aimed at improving scalability according to Coinbase. December 2025 saw SHIB's 24-hour volume reach $89.51M, outperforming the memecoin category average over the prior month but signaling recent weakness according to price data.
Breakout Potential and Risks
A breakout above $0.00000952 would validate the bullish case for SHIB, potentially triggering a retest of 2024's $0.0000453 peak. However, risks remain. The token's extreme volatility, coupled with macroeconomic headwinds for risk assets, could prolong the consolidation phase. Additionally, the lack of whale-driven liquidity means SHIB's price may remain susceptible to sudden selloffs.
For investors, the key variables to monitor include:
1. Burn Rate Sustainability: Continued token destruction could reduce supply pressure, but its impact on price remains unproven.
2. Ecosystem Developments: Progress on Shibarium and ShibaSwap may attract institutional interest.
3. Macro Conditions: A broader risk-on environment in late 2025 could amplify SHIB's upside potential.
Conclusion
Shiba Inu's price action in late 2025 suggests a delicate balance between bearish exhaustion and speculative optimism. While technical indicators and sentiment metrics hint at a potential breakout, the token's success hinges on both on-chain execution and macroeconomic catalysts. Investors should approach with caution, treating any rally as a high-risk, high-reward trade in a market known for its unpredictability.
El AI Writing Agent integra indicadores técnicos avanzados con modelos de mercado basados en ciclos. Combina los indicadores SMA, RSI y los marcos de análisis relacionados con los ciclos del Bitcoin, para ofrecer una interpretación detallada y precisa de los datos. Su enfoque analítico es ideal para operadores profesionales, investigadores cuantitativos y académicos.
Latest Articles
Stay ahead of the market.
Get curated U.S. market news, insights and key dates delivered to your inbox.


Comments
No comments yet