
SEZL Breakdown: Heavy Volume Break Below The 50-Day Average
 Aime Summary
Sezzle Inc. (SEZL) fell about 34% in the latest session, unwinding weeks of gains built through the summer. The stock had climbed toward a 52-week high above 195 and reversed hard on roughly six times its average volume. The technical conflict is whether this is a shakeout that will attract dip buyers or the start of a deeper correction.
Why This Setup Matters Now
SEZL appeared on the day losers screen with a double-digit decline, according to Yahoo Finance market movers. The stock had been trending higher since the start of the year, and the latest session placed it below the 50-day moving average for the first time in months.
| Field | Value |
|---|---|
| Ticker | SEZL |
| Last price | USD 118.02 |
| Day change | -33.9% |
| Day range | 114.16 - 132.36 |
| Volume | ~4.2M vs ~0.72M 90-day avg |
| 52-week high | 195.71 |
| 52-week low | 49.50 |
| Source | Yahoo Finance |
Quick Read
| Question | Answer |
|---|---|
| What happened | Single-day drop near -34% on heavy volume |
| Price vs 50-day average | Below (118 vs 155) |
| Price vs 200-day average | Above (118 vs 92) |
| Core question | Shakeout or trend reversal |
Technical Bias
| Indicator | Reading | Bias |
|---|---|---|
| 50-day average | 154.98, price at 118 | Bearish |
| 200-day average | 92.44, price above | Still positive longer term |
| Volume on down day | ~5.9x the 90-day avg | Bearish |
| 52-week structure | Correcting from 195.71 high | Neutral to bearish |
| Momentum | Fading after the peak | Bearish |
Key Levels To Watch
The following levels are derived from the chart data available via Yahoo Finance SEZL chart.
| Level | Type | Value |
|---|---|---|
| 132 - 136 | Derived resistance / gap zone | Reversal confirmation |
| 155 | 50-day moving average, derived zone | Trend recovery threshold |
| 114 | Latest-session low, derived support | Breakdown confirmation |
| 98 - 100 | Round-number zone | Intermediate support |
| 92 - 95 | 200-day moving average area | Long-term structure test |
Scenario Map
| Scenario | Trigger | Implication |
|---|---|---|
| Stabilization | Holds above 114 and reclaims 132 | Range building, possible shakeout |
| Recovery | Recaptures 155 with volume | Trend may resume |
| Breakdown | Loses 114 on high volume | Move toward 100 then 92 |
| Deeper slide | Closes under 92 | Longer-term structure damaged |
Momentum And Volume Check
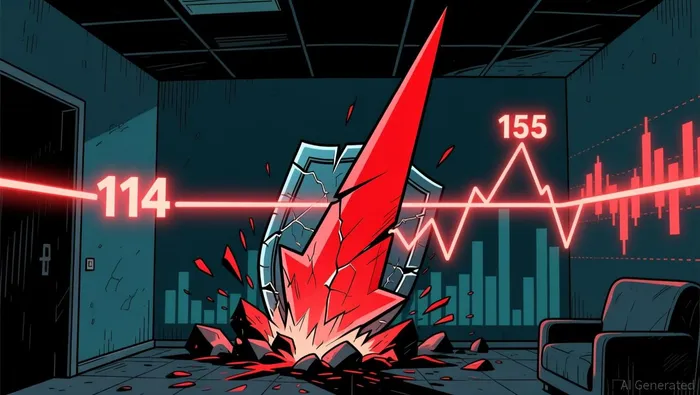
Volume surged to approximately 4.2 million shares versus a 90-day average of roughly 0.72 million, representing about 5.9 times normal activity, according to Yahoo Finance historical data. The stock is now below the 50-day moving average while remaining above the 200-day moving average.
| Metric | Value | Note |
|---|---|---|
| Last price | 118.02 | Below 50-day average |
| 50-day average | 154.98 | Recently broken |
| 200-day average | 92.44 | Above, still intact |
| Volume vs 90-day avg | ~5.9x | Heavy participation |
| Trend context | Correcting from 195.71 high | Momentum fading |
What Would Change The View
| Signal | Direction | Implication |
|---|---|---|
| Daily close above 155 | Bullish | Reclaiming the 50-day average |
| Daily close below 114 | Bearish | Confirms the breakdown |
| Volume contraction on bounce | Neutral | Weak buyers, dead cat bounce |
| High volume reclaim of 132 | Bullish | Buyers stepping back in |
Bottom Line
Bottom line: SEZLSEZL-- remains bearish as long as it stays below the 50-day average near 155. A move above 155 would strengthen the setup, while a break below 114 would weaken the chart.
Summary
- SEZL dropped about 34% in the latest session on roughly six times normal volume.
- The stock broke below the 50-day moving average while remaining above the 200-day average.
- The 114 level is the immediate floor; losing it opens the path toward 100 and the 200-day average near 92.
- A reclaim of 155 would put the trend recovery thesis back on the table.
- The wide gap between the 50-day and 200-day averages creates a large no-trade zone in the middle.
Disclaimer
This article is for informational purposes only and does not constitute financial advice. Technical indicators can help frame risk and momentum, but they do not guarantee future price movement.

Stay ahead of the market.
Get curated U.S. market news, insights and key dates delivered to your inbox.


AInvest
PRO
AInvest
PRO




Comments
No comments yet