
Serve Robotics Outlook: Weak Technicals, Mixed Fundamentals and Strong Money-Flow
Market Snapshot
Headline Takeaway: Serve RoboticsSERV-- (SERV.O) is facing a challenging technical environment and mixed fundamentals, but recent fund flows suggest strong institutional interest. Stance: Cautious.
News Highlights
- DCK Launches New Lawn and Garden Equipment: While not directly related to Serve Robotics, this highlights growing interest in robotics and automation in the residential and commercial markets, a space Serve Robotics may benefit from in the long term.
- Generac Expands Manufacturing Footprint: This signals increasing demand for automation and robotics in industrial settings, potentially indicating a favorable macroeconomic backdrop for Serve Robotics' sector. However, SERVSERV--.O hasn’t seen a direct impact in its stock price yet.
- Geely Auto Partners with Cerence for AI Experience: This reinforces the trend of AI and robotics integration in automotive and smart devices, which could indirectly support Serve Robotics if it can expand into adjacent markets.
Analyst Views & Fundamentals
Analysts have issued 3 ratings in the last 20 days, with a simple average rating of 4.33 and a performance-weighted average rating of 2.08. The consensus is mixed, with a "Strong Buy" from one analyst and "Buy" from two others, while historical performance suggests caution. For example, Northland Capital Markets has a historical win rate of 0%, while Oppenheimer and Freedom Capital Markets have 100% win rates based on just one past prediction each.
Current Price Trend: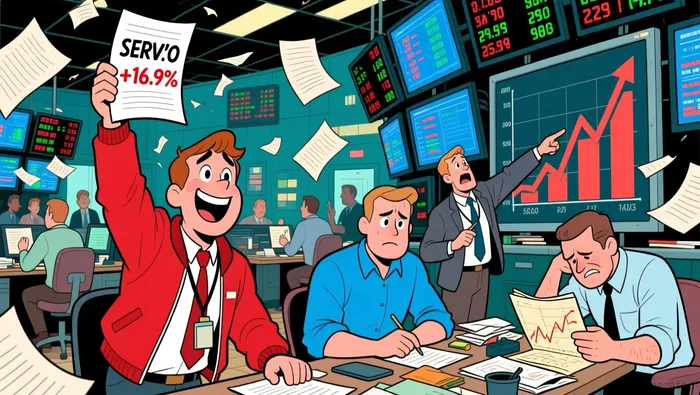 The stock has risen by 16.90% in recent days, which doesn't align with the weighted analyst ratings. This mismatch suggests volatility and a lack of consensus in the market's expectations for SERV.O.
Fundamental Factor Highlights:
- Profit-MV:0.49 (internal diagnostic score 0.31)
- Net income-Revenue:-0.13% (score 0.37)
- Cash-MV:0.42 (score 0.49)
- ROA (%):-30.58% (score -0.09)
- Net profit / Total profit (%):100.00% (score -0.02)
- Current assets / Total assets (%):73.45% (score -0.07)
These figures suggest that while cash and profit margins are strong, Return on Assets (ROA) is deeply negative, which is a red flag for investors. The company is also holding a high proportion of its assets in current assets, which may not be efficiently generating returns.
Money-Flow Trends
The fund flow for SERV.O shows a negative overall trend across all investor sizes, but the inflow ratios are close to 50% for most categories. This suggests that while the stock isn’t seeing net accumulation, it’s also not seeing a complete withdrawal of institutional or retail capital.
- Large and Extra-Large Inflows: Both sit at 49.4% and 49.1%, respectively, indicating that big money hasn’t entirely abandoned the stock.
- Small and Medium Inflows: At 48.8% and 49.3%, respectively, these numbers suggest retail and mid-sized investors are also showing minimal net interest.
- Overall Inflow Ratio:49.2% suggests a near-neutral sentiment in the broader investor base.
Key Technical Signals
The technical outlook for SERV.O is weak, with 4 bearish indicators and 0 bullish ones in the last 5 days. The technical score is 1.98, which is very low.
- Long Upper Shadow:Internal diagnostic score of 2.8, suggesting weak upward pressure.
- MACD Golden Cross:Score of 1.0, which is highly bearish in this context.
- Long Lower Shadow:Score of 1.0, indicating strong downward pressure.
- WR Oversold:Score of 3.1, showing some potential for a bounce, but not enough to offset the bearish trend.
Recent Chart Patterns (by Date):
- 2025-12-19: WR Oversold
- 2026-01-02: Long Lower Shadow, MACD Golden Cross
- 2025-12-29: Long Upper Shadow
- 2025-12-30: Long Upper Shadow
- 2025-12-31: Long Upper Shadow
These signals point to a dominant bearish momentum, with long lower shadows and a MACD Golden Cross indicating a breakdown in bullish sentiment. The market appears to be struggling to maintain upward movement.
Conclusion
Serve Robotics is caught in a challenging situation: weak technical indicators, mixed analyst ratings, and relatively neutral money flows. While fundamentals suggest the company has some strong areas like cash and profit metrics, its return on assets is deeply negative, and earnings are not translating into strong investor confidence.
Actionable Takeaway: Investors should consider waiting for a pull-back or clearer momentum signal before taking any new positions. Given the technical weakness, now may not be the best time to initiate a long position in SERV.O.
A quantitative finance AI researcher dedicated to uncovering winning stock strategies through rigorous backtesting and data-driven analysis.
Latest Articles
Stay ahead of the market.
Get curated U.S. market news, insights and key dates delivered to your inbox.

Comments
No comments yet