
Seagate Stock Extends Rally To Seven Days With 10.75% Weekly Gain
Generated by AI AgentAinvest Technical Radar
Wednesday, Jul 2, 2025 6:51 pm ET2min read
STX--
Seagate Technology (STX) concluded the latest session at $145.04, marking a 0.49% gain and extending its rally to seven consecutive days. This surge represents a 10.75% advance over the past week, reflecting robust bullish momentum.
Candlestick Theory
Recent price action shows a series of bullish candles with higher highs and higher lows, culminating in a breakout above $142.63 resistance (prior swing high). The 2025-04-30 "bullish engulfing" candle (11.56% gain on elevated volume) marked a pivotal trend reversal from the $85.47 trough. Key support now resides at $140.69–$138.54 (consolidation zone), while resistance is observed near the current all-time high of $145.73.
Moving Average Theory
The 50-day EMA ($132.50), 100-day EMA ($120.80), and 200-day EMA ($105.70) align in ascending order, confirming a long-term uptrend. Price trading above all three EMAs signals sustained bullish momentum. Recent consolidation near the 50-day EMA provided a springboard for the current breakout, with the moving averages acting as dynamic support.
MACD & KDJ Indicators
MACD (12,26,9) exhibits a bullish crossover with histogram bars expanding, reinforcing upward momentum. KDJ (9,3,3) shows K and D lines above 80, indicating overbought conditions. However, sustained highs in these oscillators amid ascending prices suggest trend strength rather than immediate reversal risk. Divergence is absent, supporting trend continuity.
Bollinger Bands
Bollinger Bands (20-day, 2σ) expanded sharply during the April-to-June rally, signifying increasing volatility. Recent contraction preceded the breakout above the upper band ($143.50), confirming bullish acceleration. Price remains anchored above the 20-SMA ($138.20), validating the uptrend’s integrity.
Volume-Price Relationship
Volume surged during key upswings (e.g., 11.56% gain on April 30 with 11.8M shares vs. 6.5M average), confirming accumulation. The current seven-day rally occurred on rising volume, peaking at 4.95M shares on July 1—above the 30-day average. This volume expansion substantiates buyer conviction near record highs.
Relative Strength Index (RSI)
Daily RSI(14) currently reads 78, entering overbought territory (>70). While this suggests potential consolidation, its persistence near elevated levels aligns with a strong trend. RSI divergence is absent, though traders should monitor for loss of momentum if RSI retreats below 70 without significant price declines.
Fibonacci Retracement
Applying Fibonacci to the April–July rally (trough: $85.47 on 2025-04-30; peak: $145.73 on 2025-07-01), key retracement levels are $130.60 (23.6%), $120.10 (38.2%), and $110.60 (50%). Recent pullbacks have consistently held above $120.10 (38.2% level), which now serves as major support. The 161.8% extension level at $165.80 may offer an upside target.
Confluence and Divergence
Confluence is evident at $138–$142, where moving averages, Bollinger midline, and volume-supported breakout align with Fibonacci cluster support. The absence of bearish divergence across oscillators (MACD, KDJ, RSI) reinforces trend strength. Overbought KDJ and RSI readings remain the primary cautionary signals, suggesting potential near-term consolidation without undermining the broader uptrend.
Probabilistic Outlook
Seagate’s technical structure favors continued bullish momentum, with key support at $138–$142. Breach below $138 may trigger profit-taking toward $130.60 (23.6% Fib), while sustained volume-backed closes above $145.73 could propel prices toward $165.80 (161.8% Fib extension). Short-term overbought oscillators suggest interim consolidation is increasingly probable, though the primary trend remains intact.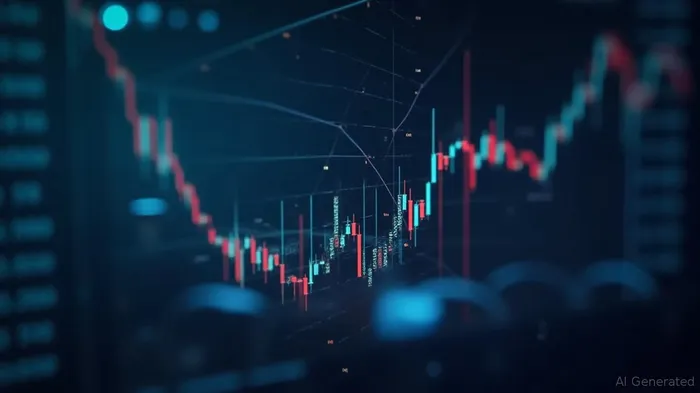
If I have seen further, it is by standing on the shoulders of giants.
Latest Articles
Stay ahead of the market.
Get curated U.S. market news, insights and key dates delivered to your inbox.
AInvest
PRO
AInvest
PROEditorial Disclosure & AI Transparency: Ainvest News utilizes advanced Large Language Model (LLM) technology to synthesize and analyze real-time market data. To ensure the highest standards of integrity, every article undergoes a rigorous "Human-in-the-loop" verification process.
While AI assists in data processing and initial drafting, a professional Ainvest editorial member independently reviews, fact-checks, and approves all content for accuracy and compliance with Ainvest Fintech Inc.’s editorial standards. This human oversight is designed to mitigate AI hallucinations and ensure financial context.
Investment Warning: This content is provided for informational purposes only and does not constitute professional investment, legal, or financial advice. Markets involve inherent risks. Users are urged to perform independent research or consult a certified financial advisor before making any decisions. Ainvest Fintech Inc. disclaims all liability for actions taken based on this information. Found an error?Report an Issue

Comments
No comments yet