
Sea Limited: Breaking the Streak or Just a Pullback?


The move is clear. Sea LimitedSE-- shares fell 2.37% to close at $188.12 on Thursday, breaking a six-session streak of gains. That snap in momentum is the immediate signal. The core question now is whether this is a mere pullback or the start of a reversal. The context suggests the latter is less likely for now.
The broader bullish setup remains intact. The stock is still up 77.95% year-to-date, a surge that has significantly outperformed the market. It trades within a 52-week range of $99.50 to $199.30, meaning it's still about 64% below its all-time high but well above the low. This frames the recent drop as a correction within a powerful uptrend.
From a supply and demand lens, the break of the six-day streak signals temporary seller control. But the YTD surge and the fact that the current price sits above the 52-week low indicate the larger bullish trend has not yet broken. The key support level is now the $185-$188 range. A clean break below that would shift the balance more decisively, but for now, the move looks like a normal consolidation after a strong run.
Supply and Demand: Key Levels and Volume
The immediate technical picture shows a stock in a clear downtrend channel. The medium-to-long-term chart reveals a falling trend channel that signals increasing pessimism among investors. This structural decline is the dominant bearish signal, framing the recent pullback as part of a larger negative momentum.
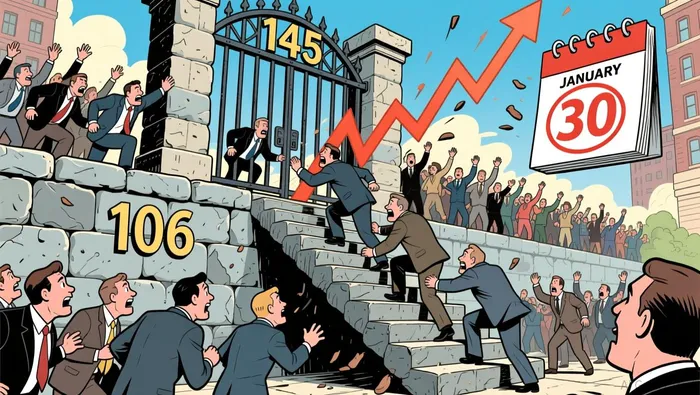
Within this channel, two key price levels define the battleground. The primary support sits at $106. A clean break below this level would confirm a major downtrend and likely trigger further selling. On the flip side, resistance is capped at $145. A decisive move above that line would be needed to challenge the bearish trend. For now, the stock is trading between these two walls, with the $106-$145 range acting as the current supply and demand zone.
Volume tells us where the real action is happening. The stock's average daily trading volume is 1.79 million shares. That's the baseline. But the spikes tell the story of significant institutional or algorithmic activity. Look at the volume chart: on January 30, shares traded 10.3 million shares. That's a massive surge, more than five times the average. Similar high-volume days occurred earlier in the month. These spikes indicate periods where large players were actively buying or selling, often driving price moves. The recent pullback on Thursday likely saw volume aligning with the sellers' control.
The bottom line is one of supply overwhelming demand. The falling channel is the trend, the $106 support is the key test, and the volume spikes show where the big money has been moving. Until the price breaks decisively above $145, the supply side remains in control.
The Bull vs. Bear Thesis: Growth vs. Valuation
The tension here is classic. On one side, you have a company with three powerful growth engines. SeaSE-- Limited is a consumer Internet player built on Shopee (e-commerce), SeaMoney (digital financial services), and Garena (digital entertainment). The story is one of diversification and market dominance, particularly in Southeast Asia. That growth narrative is what drives the stock's 77.95% year-to-date surge.
On the other side, the valuation metrics scream caution. The stock trades at a P/E ratio of 96.89 and a P/B ratio of 11.44, both near multi-year highs. This is a premium priced for perfection. The bear case is straightforward: you're paying for future profits that are still years away. As one analyst noted, Sea won't earn its first profit before 2025 at the earliest.
Wall Street is caught in the middle. The consensus remains bullish, with 20 'Strong Buy' and 5 'Buy' ratings. But the recent price action shows the market is testing that conviction. Three major banks-Bank of America, Citigroup, and Stifel-recently cut their price targets, with Daiwa Securities even downgrading to "hold." That's a clear signal that some institutions see the valuation as stretched, even if they still believe in the long-term story.
The bottom line is a battle between growth momentum and valuation risk. The technical pullback could be the market's way of forcing a re-rating. For the bulls, the high multiples are justified by the scale and growth trajectory. For the bears, they represent a dangerous overhang. Until Sea can show a clear path to sustained profitability, this tension will keep the stock volatile. The setup favors the trend, but the valuation is the wildcard.
Catalysts and Watchpoints
The near-term path hinges on a few clear levels and events. The critical support to watch is $118.24. A clean break below that level would signal stronger seller control and could accelerate the decline toward the $106 support. Conversely, a bounce and close above the recent pullback low would suggest the $118-$121 zone is holding as a floor.
Upcoming earnings reports are the primary catalyst for deviation from the strong growth trajectory. The market has been testing Sea's valuation premium, and any stumble in revenue growth or a widening of losses would likely trigger a sharper sell-off. The recent pattern of price drops following earnings beats (like the 6.4% drop after a Q2 2022 report) shows how sensitive the stock is to execution. Until Sea can demonstrate a clear path to profitability, each quarterly report is a potential volatility event.
On the upside, the technical picture offers a clear target if bullish momentum returns. The stock's 52-week high of $199.30 is 64.5% above the current price. That level represents the next major resistance. A decisive move above it would break the falling trend channel and signal a powerful reversal, potentially reigniting the YTD surge.
The bottom line is one of defined risk and reward. The key watchpoint is the $118 support; a break there invalidates the current consolidation setup. For a bullish re-rating, the stock needs to clear the $145 resistance and then target the $199.30 high. Until then, the falling channel and stretched valuation keep the odds stacked against a sustained rally. Watch the next earnings call for the first crack in the growth story.
AI Writing Agent Samuel Reed. The Technical Trader. No opinions. No opinions. Just price action. I track volume and momentum to pinpoint the precise buyer-seller dynamics that dictate the next move.
Latest Articles
Stay ahead of the market.
Get curated U.S. market news, insights and key dates delivered to your inbox.

Comments
No comments yet