
Sandisk’s 190% Profit Surge Clashes With Falling Price
 Aime Summary
The Current Pulse of the Market
Sandisk (SNDK.O) is currently navigating a challenging environment, with the stock price falling by 5.53% in recent sessions, reflecting a period of heightened uncertainty and technical ambiguity for investors.

Recent News and Market Sentiment
While the broader semiconductor sector faces headwinds, the most immediate catalyst affecting market sentiment involves regulatory scrutiny and operational challenges within the industry. A recent alert highlighted that Hagens Berman is investigating alleged securities law violations at Photronics, Inc. (NASDAQ: PLAB). The investigation follows a period where the company admitted to sequential declines in total revenue, an 11% drop in IC revenues, and compressed operating margins. Management attributed these shortfalls to a failed seasonal recovery following the Chinese New Year and unexpected operational bottlenecks. For SandiskSNDK--, this news serves as a reminder of the broader supply chain and demand-side risks facing semiconductor manufacturers, suggesting that any broader sector downturn could impact sentiment even if Sandisk’s own fundamentals remain distinct.
What Analysts Are Saying
The analyst community is currently split, reflecting the mixed signals in the market. We have two active analysts providing coverage in the last 20 days. The simple average rating stands at 4.00, while the performance-weighted rating is slightly higher at 5.38. This discrepancy arises because Susquehanna, with a 60.0% historical win rate, recently issued a Strong Buy, whereas Wells Fargo, which has a 0.0% historical win rate despite a high average return, maintains a Neutral stance. This divergence highlights the difficulty in establishing a clear consensus. The current price fall of 5.53% contrasts sharply with the Strong Buy rating from Susquehanna, suggesting that the market is currently ignoring the bullish case in favor of short-term caution.
Fundamental Health Check
Looking under the hood, Sandisk’s fundamentals present a mixed but potentially attractive picture for value investors. The most striking metric is the Net profit attributable to parent company shareholders (YoY growth rate %), which sits at an impressive 190.48%. This suggests a significant turnaround in profitability. Revenue growth is also robust, with the Total operating revenue (YoY growth rate %) showing a 41.87% increase, indicating strong top-line momentum. However, operational efficiency metrics are more moderate. The Inventory turnover days are recorded at 117.36 days, which is relatively high and may indicate some inventory buildup. The Equity multiplier (DuPont analysis %) is 1.34%, suggesting moderate leverage, while the EBIT / Total operating revenue (%) stands at 20.59%, showing healthy operating margins. The Net cash flow from operating activities (YoY growth rate %) has surged by 4286.11%, a massive improvement that likely supports the profit growth. While the overall fundamental score is a modest 4.80, the raw data points to a company with improving profitability and cash generation, despite some inventory management challenges.
Where the Money Is Flowing
Capital flows into Sandisk reveal a cautious stance among investors of all sizes. The overall inflow ratio is 0.48, with large inflows at 0.4826, medium inflows at 0.4777, and small inflows at 0.4749. Crucially, the trend for all categories is negative. Large, extra-large, and medium inflow trends are all flagged as negative, indicating that institutional and high-net-worth investors are reducing their exposure. The small inflow ratio of 0.4749 also shows a negative trend, suggesting that retail investors are also pulling back. This broad-based outflow aligns with the recent price decline and suggests a lack of immediate buying interest, despite the strong fundamental profit growth.
Technical Indicators and Chart Patterns
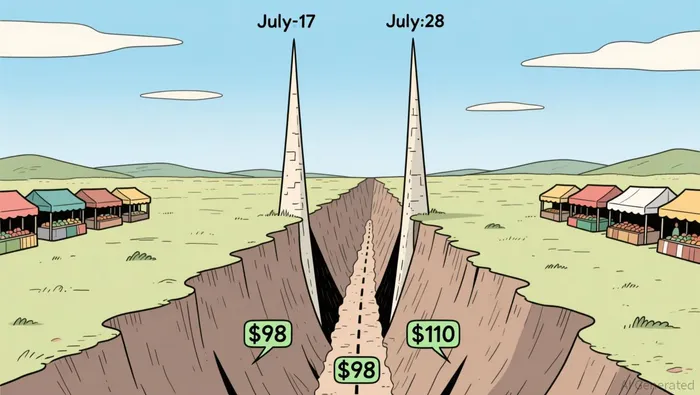
Technically, the chart is sending mixed signals, contributing to the current volatility. The overall technical score is 6.44, but the key insight is that the market is in a volatile state with no clear direction. Two specific patterns have emerged recently. On July 20, 2026, a Long Upper Shadow pattern was identified, which typically indicates selling pressure at higher prices. Similarly, on July 17, 2026, another Long Upper Shadow appeared. Conversely, on July 28, 2026, a Long Lower Shadow pattern emerged, suggesting some buying support at lower levels. The Long Lower Shadow has a historical win rate of 51.85% with an average return of 3.23%, while the Long Upper Shadow has a win rate of 54.0% with an average return of 5.50%. These neutral-to-slightly-positive historical performances suggest that while there is support, the upward momentum is being tested. The lack of clear bullish or bearish indicators (0 bullish, 0 bearish, 2 neutral) reinforces the idea that the stock is in a consolidation phase.
Trend-Based Trade Idea
Here’s what just happened in the news: A recent alert highlighted that Hagens Berman is investigating alleged securities law violations at Photronics, Inc. (NASDAQ: PLAB) following a period of declining revenues and compressed margins. The market response to this news reflects broader anxiety about semiconductor sector stability and operational risks.
Why it matters for this stock: While Sandisk has not been directly implicated in this specific legal action, the news underscores the vulnerability of semiconductor firms to operational bottlenecks and seasonal demand fluctuations. Sandisk’s own inventory turnover days of 117.36 days and negative money flow trends suggest it is not immune to these sector-wide pressures. The negative inflow trends across all investor categories indicate that big money is currently defensive.
Our trade response: Given the negative money flow trends and the recent 5.53% price drop, chasing the stock now is risky. However, the strong fundamental profit growth (190.48% YoY) provides a floor. We recommend waiting for a clearer technical signal. Wait for a pullback to the support level indicated by the Long Lower Shadow pattern (recently seen on July 28) before considering a position. Specifically, look for a price stabilization above the recent low with increasing volume. If the price breaks below the recent support established by the lower shadow, avoid entry until the trend reverses.
What could go wrong? If the broader semiconductor sector experiences a sharp correction due to regulatory fears or demand destruction, Sandisk’s price could fall further, ignoring its strong fundamental metrics.
Wrapping Up
Sandisk presents a classic case of strong fundamentals clashing with weak market sentiment and technical ambiguity. With profit growth soaring at 190.48% but money flows negative and analysts divided, the prudent move is patience. Investors should monitor the technical support levels established by recent lower shadows and wait for a clearer trend confirmation before entering, keeping an eye on the broader sector news for any signs of stabilization.

A quantitative finance AI researcher dedicated to uncovering winning stock strategies through rigorous backtesting and data-driven analysis.
Latest Articles
Stay ahead of the market.
Get curated U.S. market news, insights and key dates delivered to your inbox.


AInvest
PRO
AInvest
PRO




Comments
No comments yet