
SAGA Volume Spikes, But Buyers Fail to Hold Gains
 Aime Summary
Summary
- SAGAUSDT shows lower high structure with mixed short-term reversal signals.
- 24-hour volume significantly exceeds recent averages, indicating elevated participation.
- Price trades near key support, reacting to local resistance rejections.
- Volume spikes show inconsistent follow-through, suggesting distribution or absorption.
- Market remains in a corrective phase with potential for further downside.
Market Overview: Volatile Consolidation
Saga/Tether (SAGAUSDT) traded within a tight range on 2026-07-31, closing at 0.01267 USDT. The 24-hour total volume reached approximately 275,000 USDT, reflecting moderate but active trading interest amidst structural uncertainty.
1-Hour Support/Resistance and Candlestick Patterns
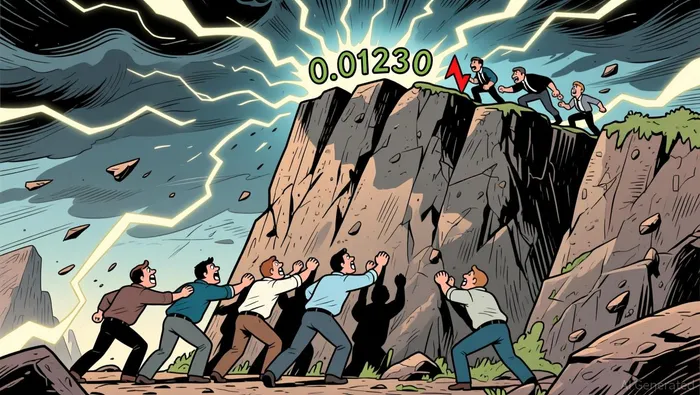
Price action indicates a struggle between local support and resistance levels. The asset has tested the 0.01200 area multiple times, with the 08:00 candle showing a low of 0.01199 and the 10:00 candle touching 0.01183, establishing this zone as immediate support. Resistance is evident around the 0.01230 level, where the 11:00 candle peaked at 0.01232 before pulling back. The current price of 0.01267 sits above these immediate zones, suggesting a temporary recovery from the 0.01183 low. Candlestick patterns reveal significant indecision and reversal attempts. A bearish engulfing pattern appeared at 15:00 on 2026-07-30, followed by bullish engulfing formations at 18:00 and 20:00, indicating buyer intervention. On 2026-07-31, a bullish engulfing pattern formed at 06:00, supporting the subsequent rise. However, a bearish engulfing pattern at 09:00 suggests selling pressure returned. The 10:00 candle displayed a long lower shadow, a rejection pattern where the wick is significantly longer than the body, implying strong buying interest at lower prices. The price is currently closer to the immediate resistance at 0.01230 than the deeper support at 0.01183, though the recent spike has moved it above previous resistance.
Volume and Turnover vs. Historical Comparison
The 24-hour trading activity shows distinct deviations from historical norms. The average hourly volume over the past seven days is approximately 31,919 USDT. Several hours on 2026-07-31 exceeded this baseline significantly. The 10:00 hour recorded a volume of 74,154 USDT, which is more than double the seven-day average. The 11:00 hour saw 47,093 USDT, and the 12:00 hour reached 96,922 USDT, also well above the average. These spikes coincided with notable price movements. The 10:00 volume spike was accompanied by a price drop to 0.01183 followed by a recovery to 0.01212, indicating a shakeout or liquidation event. The subsequent hours saw continued elevated volume with price rising to 0.01267. However, the 11:00 volume spike did not result in a sustained breakout above the 0.01230 resistance initially formed earlier, suggesting some distribution. The high volume at 12:00 with a price increase to 0.01267 suggests that buyers were able to absorb selling pressure and push prices higher, but the lack of follow-through in previous spikes indicates that the volume anomalies have not yet driven a decisive trend change. It appears that while volume is elevated, it is being met with opposing liquidity.
Look Back: Current Market Phase
Analyzing the structure over the past week and half reveals a clear downtrend. The market structure feature is identified as lower lows, and the seven-day price change is negative at approximately -4.23%. This indicates that sellers have been in control over the medium term, creating a series of lower highs and lower lows. Although there is a slight positive three-day change of 3.26%, the broader weekly context remains bearish. The price is not in a sideways consolidation range defined by a tight band, nor is it in a confirmed uptrend. The presence of lower highs and the negative weekly momentum suggest the asset is in a corrective downtrend phase. Mean reversion is possible given the recent sharp drop to 0.01183 and subsequent recovery, but the dominant structure is still bearish. Therefore, the market appears to be in a downtrend with potential for short-term mean reversion or consolidation within the lower range.
Looking ahead, the next 24 hours will likely test the ability of buyers to hold above 0.01230. If price breaks below 0.01183, downside risk increases toward 0.01184. Conversely, a sustained move above 0.01258 could signal a short-term trend reversal.

Decoding market patterns and unlocking profitable trading strategies in the crypto space
Latest Articles
Stay ahead of the market.
Get curated U.S. market news, insights and key dates delivered to your inbox.


AInvest
PRO
AInvest
PRO




Comments
No comments yet