
Rulebook vs. Reality: Why the Athletics-Red Sox Market Demands More Than a Scoreboard
 Aime Summary
Lead
The prediction market for the August 7, 2026, Athletics–Red Sox contest is pricing in a heavy Boston victory, but the current price action reflects more than just a simple win probability. While the Red Sox enter as significant favorites, a sharp 24-hour price swing raises questions about whether the market is efficiently pricing in on-field fundamentals or reacting to thin liquidity and rule-based settlement risks. This article dissects the gap between the true event probability and the contract’s embedded resolution mechanics, arguing that the final settlement scenario is not as straightforward as the moneyline odds suggest.
Event Definition
This market is a binary contract on the winner of the Major League Baseball game between the Oakland Athletics and the Boston Red Sox. The contract resolves to a price of 100% for the winning team, provided the game is played to completion. The core disagreement among traders is not just about which team is superior, but whether the market is adequately discounting the specific settlement rules for a tie or a cancellation, which would force a 50-50 split regardless of pre-game expectations.
Latest News & Information Increments
The primary fundamental driver for this market is the stark performance gap between the two clubs. The Red Sox, sitting third in the AL East, have dominated the season series, winning three of the first four matchups, while the Athletics are mired in a 1-9 slump over their last ten games and are riding a five-game road losing streak. This disparity is amplified by the pitching matchup: Boston’s Payton Tolle (6-6, 3.30 ERA) holds a significant advantage over Oakland’s Jack Perkins (2-7, 6.72 ERA). The effective information here is the combination of recent form and starting pitching quality, which overwhelmingly points to a Boston win. The noise lies in the extreme betting odds, which already embed this narrative. The Red Sox are listed as -245 moneyline favorites, and the total is set at 8.5 runs, with trends favoring the over due to Perkins’ struggles. This means the market is operating in a high-information environment where the directional signal is clear, leaving little room for incremental positive surprises for Boston, but substantial asymmetry for an Oakland upset.
Market Resolution Rules Analysis
The contract settles based on the official final statistics of the event as recognized by the governing body. The critical rule is that a tie game or a canceled game that is not made up will not resolve to the favorite; instead, it will resolve 50-50, returning capital evenly to both sides. The primary source for settlement is the official league statistics, with a backup mechanism: if the governing body fails to publish final statistics within 24 hours of the event’s conclusion, a consensus of credible reporting will be used to determine the winner.
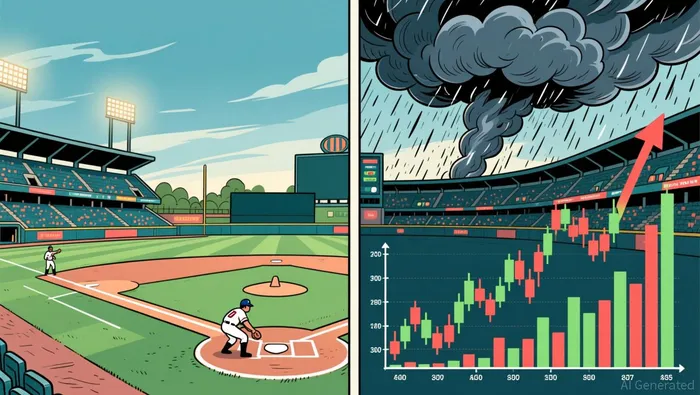
Rule Risk Points & Disputed Scenarios
The most significant risk is the ambiguity surrounding a tie or cancellation. If the game is canceled entirely with no make-up date, the market resolves 50-50, completely nullifying any pre-game probability advantage for Boston. A secondary, though less likely, risk is a delay in the publication of official statistics. Should the league’s official data feed fail, the reliance on a “consensus of credible reporting” introduces a layer of subjectivity that could be disputed if multiple sources report conflicting results, potentially delaying resolution and trapping capital.
Market Overview
The current pricing structure suggests a market that has aggressively priced in a Boston victory, yet the price action itself reveals a recent, significant repricing event. The market has experienced a maximum single-day price change of approximately 62 percentage points, indicating a violent shift in sentiment or a correction from a prior mispricing. Over the past week, the maximum price change is a decline of roughly 29 percentage points, a move that overlaps with the one-month and one-year periods, suggesting this recent downturn is the most significant volatility event in the contract’s observable history. This implies that the current price is not a stable equilibrium but rather a point on a volatile trajectory, likely driven by a combination of late-breaking news and position squaring ahead of the event.
Market Dynamics (Volatility & Volume)
The market’s volatility is not merely a reflection of changing win probabilities; it is amplified by liquidity dynamics. The 24-hour volume has surged to over $1.14 million, a massive spike that dwarfs the total volume of $1.16 million, indicating that virtually all trading activity has occurred in the last day. This concentration of volume suggests that the recent 62-percentage-point price swing was backed by genuine, high-conviction trading rather than a few errant clicks in a thin order book. However, the sheer speed of the repricing, combined with the fact that the 1-week, 1-month, and 1-year price changes are identical, paints a picture of a market that was previously illiquid or dormant. The sudden influx of capital has awakened the contract, but the price discovery process is compressed into a very narrow window, making the current price highly sensitive to the last large trade.
Trading Judgment & Follow-up Observation Points
The current price embeds a strong Boston bias, but the existence of the 50-50 cancellation rule means the market is not a pure bet on the Red Sox. Traders must monitor not just the scoreboard but the weather forecast for Fenway Park and the league’s official data feed status. The key variable to track is the probability of a game interruption or cancellation, as this tail risk is asymmetrically punitive to “Yes” shares on Boston. A price that approaches 100% for Boston implies a near-zero chance of a 50-50 settlement, a condition that may be overly optimistic given the binary nature of the resolution rules.

Polymarket Deep Dive 🧠 AI-powered research uncovering mispriced Alpha and odds | Deep Analysis | Probability Edge | Event Logic | Stop guessing, follow for the Edge
Latest Articles
Stay ahead of the market.
Get curated U.S. market news, insights and key dates delivered to your inbox.


AInvest
PRO
AInvest
PRO




Comments
No comments yet