

In early June 2026, with AI chip stocks in a rout after the sector's worst week of the year, Jensen Huang stood in Seoul and told investors to buy the pullback "at a discount." Two months later the tape looked as if it had vindicated him: NVDA rose 5.1%, barely edging the S&P 500's 4.3% and trailing a basket of Microsoft, Amazon, and Alphabet that gained 8.5%. By price alone, this was an average win in a rising market — not the home run the headline suggested.
The real validation never showed up in the tape. It showed up in the earnings print.
Nvidia reported Q2 FY2027 revenue of $96.2 billion, up 106% year over year and 18% quarter over quarter. The engine was a single segment: data center came in at $89.0 billion, up 117% year over year and equal to 92.5% of the company's total. And the ramp wasn't bought with margin — gross margin printed 75.0% on both a GAAP and non-GAAP basis, up 2.6 points year over year.
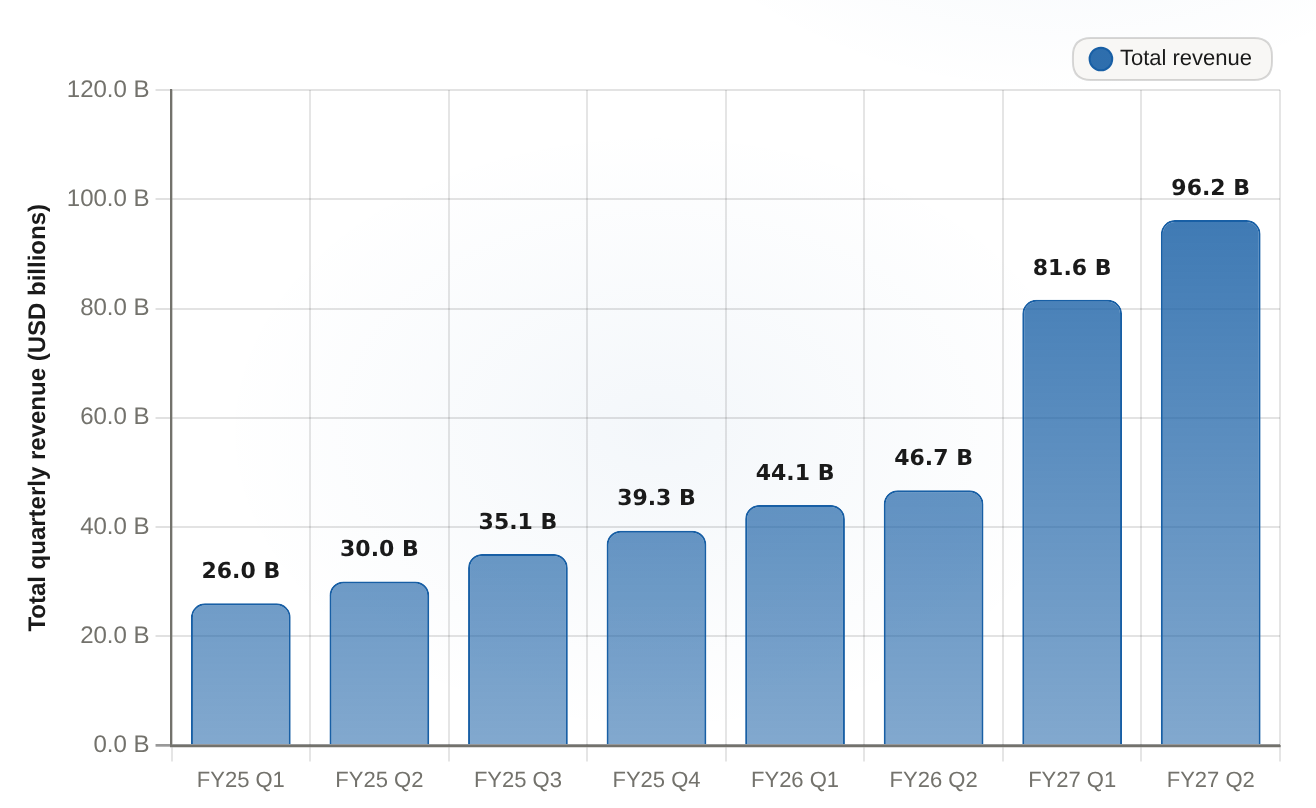
Nvidia revenue re-accelerated sharply in Q2 FY27 to $96.2B, led by the Vera Rubin data-center ramp — data center hit $89.0B, 92.5% of total, up 117% YoY — the fundamentals behind the CEO's buy-the-dip call.
| Period | Total revenue (B) |
|---|---|
| FY25 Q1 | 26.04 |
| FY25 Q2 | 30.04 |
| FY25 Q3 | 35.08 |
| FY25 Q4 | 39.33 |
| FY26 Q1 | 44.06 |
| FY26 Q2 | 46.74 |
| FY27 Q1 | 81.6 |
| FY27 Q2 | 96.2 |
The re-acceleration rides on a named product cycle rather than a sector tailwind. The Vera Rubin platform is in what NvidiaNVDA-- calls "full production," with racks running at CoreWeave, Google Cloud, Microsoft Azure, Oracle Cloud Infrastructure, and Nebius. That is the difference between a CEO talking up a drawdown and a product ramp actually delivering into revenue — and it is the concrete reason the buyer's thesis had operating teeth.
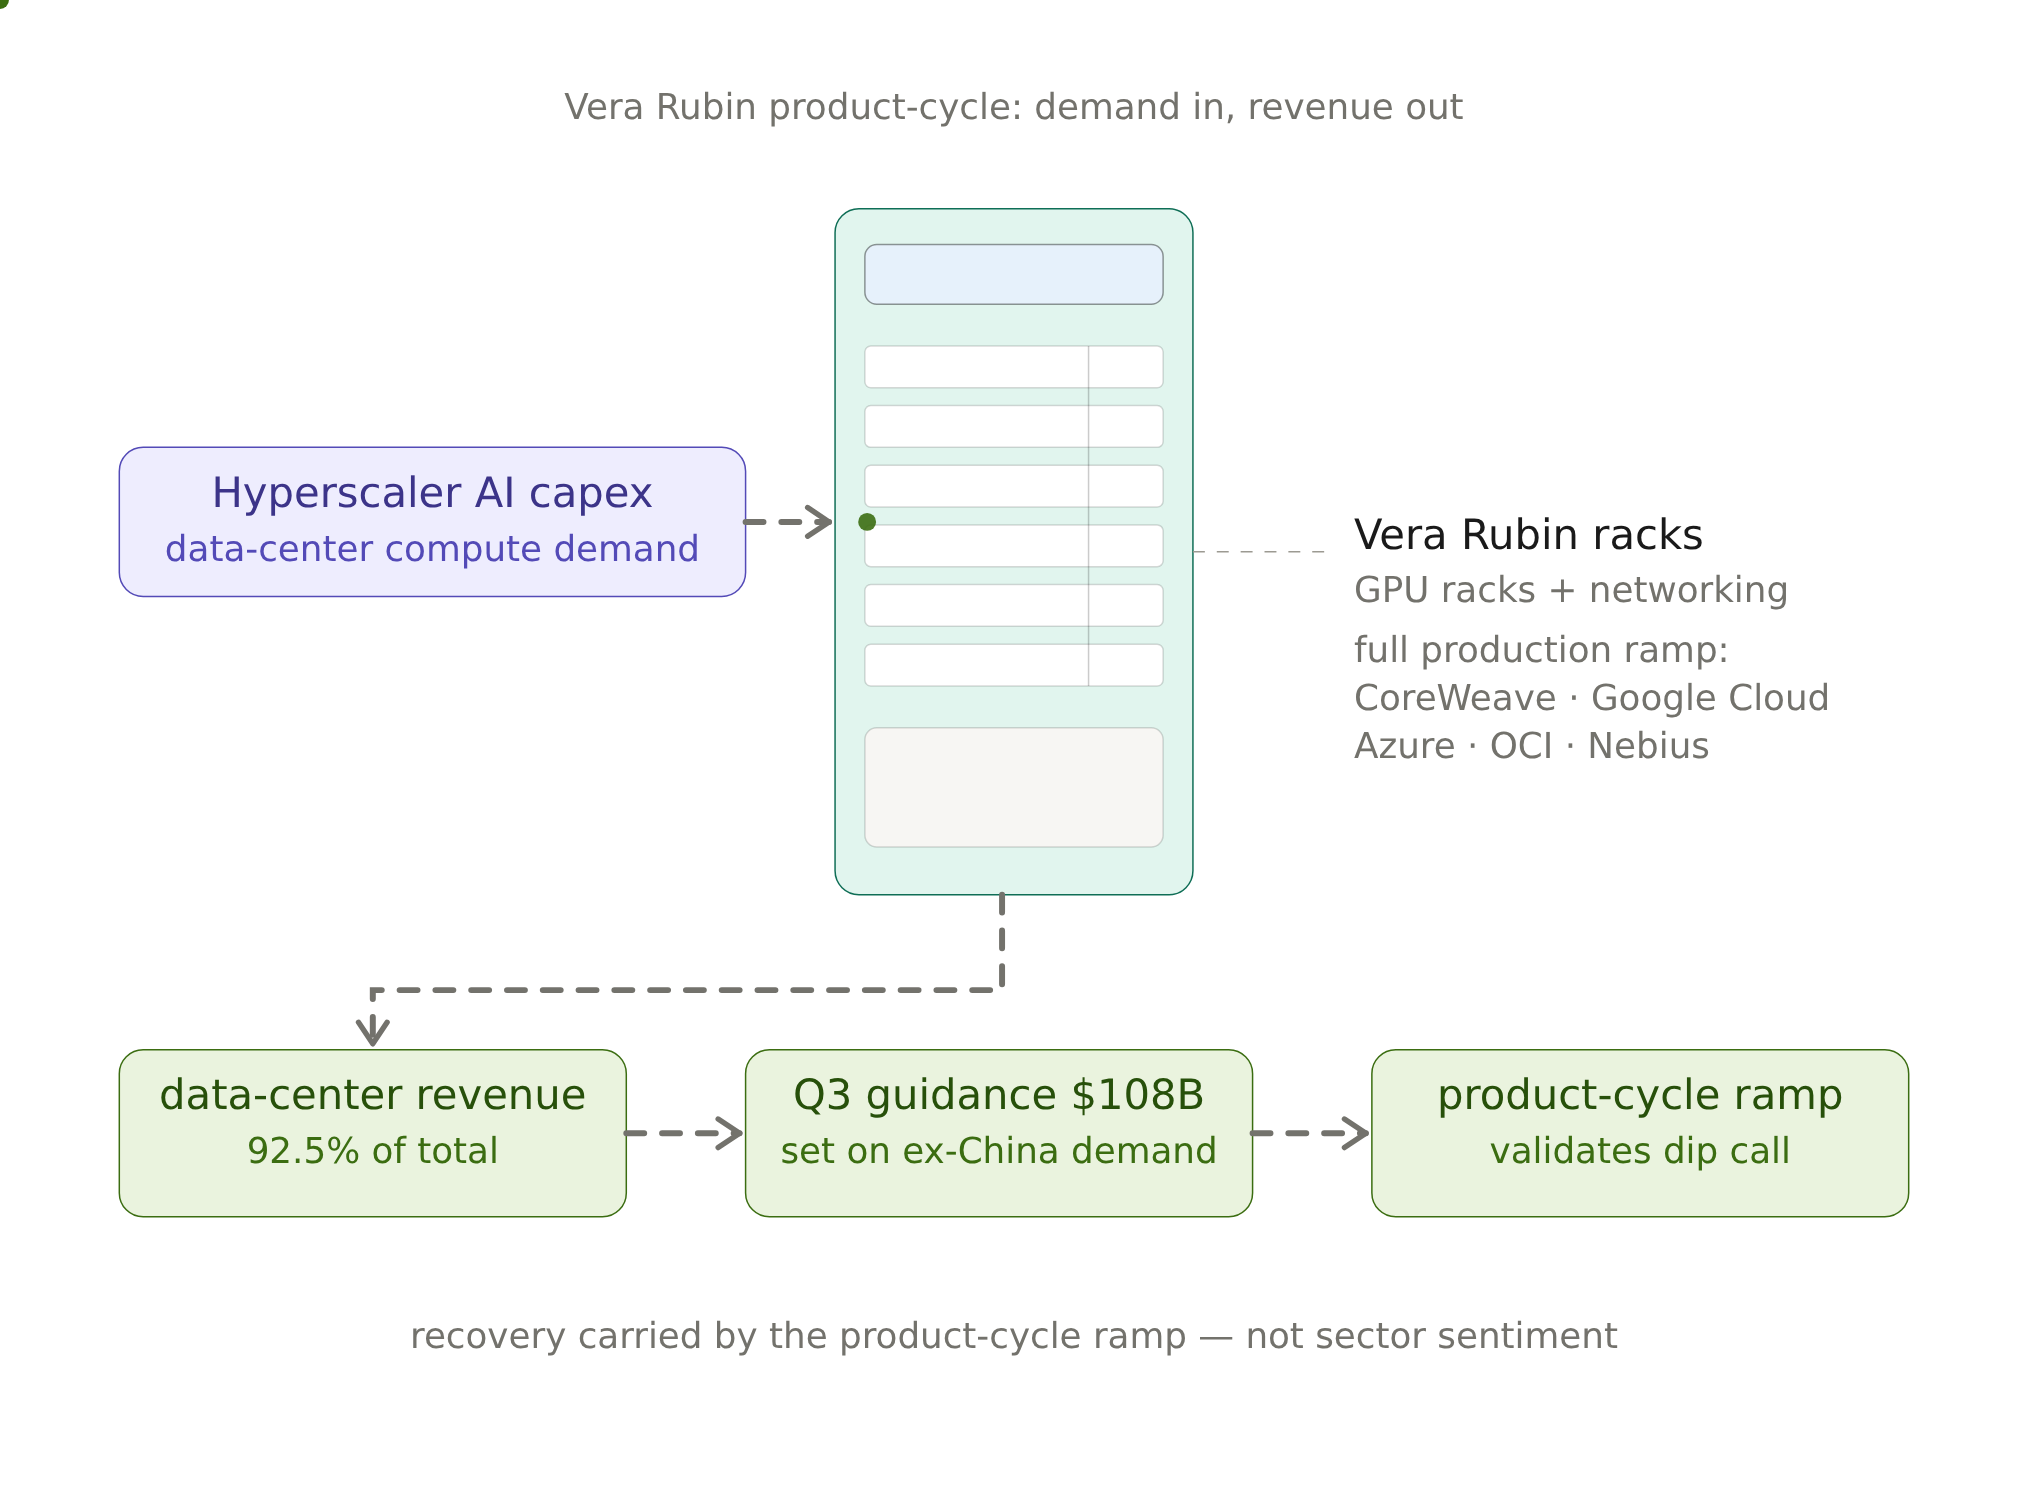
Annualize the quarter and the scale is easier to hold: $96.2 billion times four puts Nvidia on roughly a $385 billion revenue run-rate, with data center alone running near $356 billion. Management's guide for the current quarter is $108 billion — a step up of about 12% at the run-rate level — set entirely without China, since the outlook explicitly assumes no data-center compute revenue from that market. To be clear, none of this proves the June call caused the revenue; it doesn't. What it establishes is that the thesis was borne out by delivery, not by sentiment.
That concentration is the risk as much as the reward. With 92.5% of revenue in a single segment, the post-dip position is only as durable as the data-center ramp — so the variable that will confirm or break the thesis is that segment's year-over-year growth, 117% this quarter. If it falls materially below roughly 90% (from 117%) while total growth slips under 60% (from 106%), the re-acceleration has already begun to break. Until then, the June call stands for the right reason: Rubin delivered. Not a CEO's optimism.








Comments
No comments yet