
Roblox Stock Drops 3% Amid Bearish Technical Signals And Distribution Pressure
Generated by AI AgentAinvest Technical Radar
Thursday, Aug 21, 2025 6:08 pm ET3min read
RBLX-- Aime Summary
Roblox (RBLX) declined 3.07% in the most recent session, closing at $114.85 after trading between $113.70 and $118.00 on moderate volume of approximately 6.97 million shares. This price action reflects ongoing distribution pressure within a broader corrective phase.
Candlestick Theory Analysis
Recent price action reveals significant bearish signals. The August 18th session formed a distinct shooting star candle (high: $121.30, close: $119.95), suggesting rejection near psychological resistance at $120. This was followed by a strong bearish engulfing pattern on August 15th (open near $125.28 previous close, close at $117.34), confirming downside momentum. Immediate support is identified near $112.00-$114.00, where wicks consolidated in mid-August. Resistance is firmly established at $118.00-$120.00, reinforced by the August 19th and 20th highs failing to close above this zone. A confirmed break below $112.00 may accelerate selling.
Moving Average Theory Analysis
Roblox exhibits deteriorating trend structure based on key moving averages. The 50-day MA (~$121) crossed below the 100-day MA (~$109) recently, signaling a bearish medium-term crossover. Price is trading decisively below the 50-day and 100-day MAs, indicating persistent weakness. The longer-term 200-day MA (~$77) slopes upward but remains distant, confirming the primary uptrend is intact though the stock is in a significant short-to-medium term corrective phase. Current MA alignment suggests bearish control is likely to persist near-term.
MACD & KDJ Indicators Analysis
The MACD (12,26,9) remains in negative territory with the signal line above the MACD line, reflecting sustained bearish momentum. While the histogram shows minor flattening, it remains below the zero line, suggesting no strong reversal signal is evident yet. KDJ metrics indicate the K-line (slower) is below the D-line (faster) and both are trending downwards, hovering near neutral territory (K: ~40, D: ~50). This KDJ configuration suggests downward momentum persists without reaching oversold extremes (<20), implying potential further downside room before a tactical low forms.
Bollinger Bands Analysis
Bollinger Bands (20 periods, 2 std dev) show moderate expansion compared to late July/early August, reflecting increased volatility during the recent decline. Price currently trades near the lower band ($113-$114), suggesting potential oversold conditions within the context of the current downtrend. However, repeated tests of the lower band without significant rebound signal continued weakness. A sustained move below the lower band could signal capitulation, while a reversal above the middle band ($123-$124) would be needed for a technical recovery signal.
Volume-Price Relationship Analysis
Volume patterns provide bearish confirmation. High-volume sessions consistently coincide with price declines – notably on August 15th (volume: ~18.74m shares, price decline: -6.34%), July 31st (volume: ~24.67m shares, price increase: +10.28% – a potential blow-off top), and July 1st (volume: ~15.01m shares, decline: -9.26%). Conversely, recovery attempts often occur on below-average volume (e.g., August 19th, 20th). This persistent distribution (selling on strength or volume supporting declines) undermines recovery efforts and signals weak conviction among buyers. The high-volume breakdown through $120 reinforces its significance as resistance.
Relative Strength Index (RSI) Analysis
The daily RSI (14-period) currently reads approximately 45-47, moving down from neutral levels near 50. While not yet in the oversold zone (<30), this negative momentum divergence suggests bearish pressure is increasing. Previous visits into oversold territory (e.g., early May, late March) led to sharp rallies. However, the RSI's inability to climb firmly above 50 during recent bounce attempts highlights persistent weakness. It currently offers no imminent oversold warning, suggesting further downside potential exists before reaching historically attractive reversal zones. Caution is warranted as the RSI can remain neutral during trending moves.
Fibonacci Retracement Analysis
Applying Fibonacci retracement to the significant rally from the June 2024 low (approx. $39-$40) to the July 2025 peak ($150.59) reveals key technical levels. The 38.2% retracement level resides near $114.50 – aligning closely with the current price and recent minor support zone ($112-$115). A decisive close below $114.50 targets the significant 50% retracement at $106-$107 and then the 61.8% retracement near $97-$98. The July low near $100.00 offers a psychological support level just above the 61.8% retracement. The rally faltered precisely near the 0% retracement of the prior downswing within the current pullback (using June peak and July trough), highlighting the importance of Fibonacci confluence zones.
Confluence & Divergence Summary
Significant bearish confluence exists:
Resistance confluence: $118-$120 (candlestick rejection, horizontal price action, psychological level, proximity to 50/100-day MAs).
Breakdown confluence near $112-$114 (recent support wicks, 38.2% Fibonacci retracement, lower BollingerBINI-- Band).
Bearish divergence is evident between volume/price action (weak volume on rallies, high volume on declines) and price/RSI (lower lows not yet confirmed by deeply oversold RSI). KDJ and MACD show bearish alignment without positive divergences. A confirmed break below $112-$114, especially on increased volume, would activate the bearish confluences targeting the $107 and $98 Fibonacci levels. Recovery requires reclaiming the $120 resistance with convincing volume.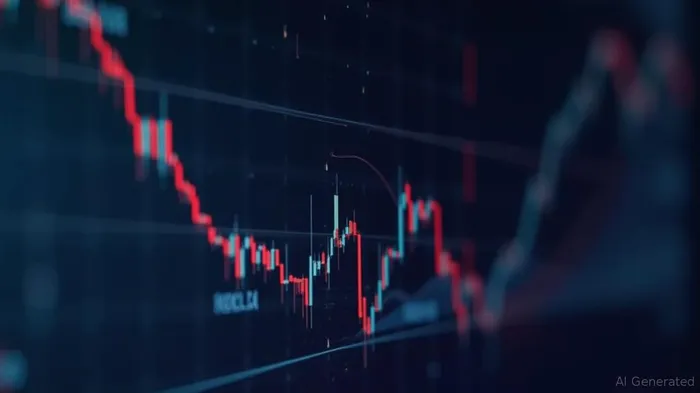
If I have seen further, it is by standing on the shoulders of giants.
Latest Articles
Stay ahead of the market.
Get curated U.S. market news, insights and key dates delivered to your inbox.
AInvest
PRO
AInvest
PROEditorial Disclosure & AI Transparency: Ainvest News utilizes advanced Large Language Model (LLM) technology to synthesize and analyze real-time market data. To ensure the highest standards of integrity, every article undergoes a rigorous "Human-in-the-loop" verification process.
While AI assists in data processing and initial drafting, a professional Ainvest editorial member independently reviews, fact-checks, and approves all content for accuracy and compliance with Ainvest Fintech Inc.’s editorial standards. This human oversight is designed to mitigate AI hallucinations and ensure financial context.
Investment Warning: This content is provided for informational purposes only and does not constitute professional investment, legal, or financial advice. Markets involve inherent risks. Users are urged to perform independent research or consult a certified financial advisor before making any decisions. Ainvest Fintech Inc. disclaims all liability for actions taken based on this information. Found an error?Report an Issue

Comments
No comments yet