
REZUSDC Volume Spikes, But Sellers Block the Rally
 Aime Summary
Summary
- REZUSDC trades near $0.004658 with elevated 24h volume against declining historical averages.
- Market structure shows higher highs but recent bearish engulfing candles signal immediate selling pressure.
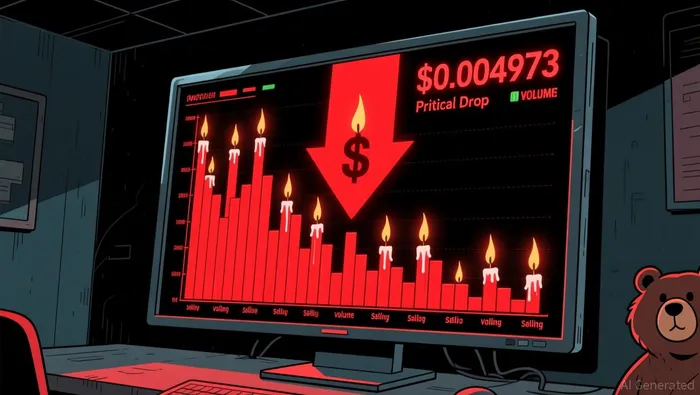
- Key resistance at $0.004973 rejected multiple times, while support holds around $0.004234.
- Volume spikes failed to sustain upward momentum, suggesting distribution rather than accumulation.
- Next 24h likely sees consolidation or downside correction if $0.004504 support breaks.
Severe Correction
Renzo/USDC (REZUSDC) closed the 1-hour period at $0.004658, reflecting a volatile session driven by significant volume anomalies. The 24-hour total volume reached approximately 138.5 million, indicating active trading participation despite the lack of decisive directional follow-through.
1-Hour Support/Resistance and Candlestick Patterns
Price action has established a clear range with resistance clustered near $0.004973 and $0.005135, where multiple upper wicks and bearish engulfing patterns confirmed rejection. The 06:00 and 07:00 candles on 2026-09-14 demonstrate this clearly, with the latter closing near its low after failing to hold the $0.004970 level. Support is currently testing the $0.004234 to $0.004406 zone, marked by long lower shadows that suggest temporary buyer intervention. The current price of $0.004658 sits closer to the mid-range resistance, leaning toward the upper half of the recent consolidation box. A bearish engulfing pattern at 01:00 and another at 07:00 indicate that sellers are actively defending the higher levels, while doji formations at 08:00 suggest indecision before the latest dip.
Volume and Turnover vs. Historical Comparison
The 24-hour total volume of roughly 138.5 million tokens significantly exceeds the 15-day average daily volume of 52.4 million, yet remains well below the 7-day average daily volume of 103.1 million. This discrepancy suggests that while recent activity is intense, it is not yet sustaining the higher baseline seen in the previous week. Several hours exhibited volume spikes well above the 7-day hourly average of 4.3 million, notably at 12:00 on 2026-09-13 with 47.7 million in volume and 09:00 on 2026-09-14 with 9.4 million. However, the high volume at 12:00 resulted in a price drop from $0.00394 to $0.004832 only after a volatile swing, and the spike at 09:00 on 2026-09-14 was followed by a price decline to $0.004321. These instances indicate that high volume did not drive sustained upward momentum; instead, it appears to have facilitated distribution or profit-taking. The lack of follow-through after these volume anomalies suggests that the buying pressure was absorbed rather than pushing prices higher.
Look Back: Current Market Phase
The 7-day price change of 48.58% and 3-day change of 24.65% indicate a strong prior uptrend. However, the recent price action shows a deviation from the higher-high structure, with a series of lower lows forming since the peak near $0.005135. The market structure feature is noted as higher high, but the immediate price behavior suggests a potential mean reversion or correction phase following the significant prior move. The presence of multiple bearish engulfing candles and long upper shadows after sharp rallies supports the view that the market is currently undergoing a corrective phase within a broader uptrend. This phase appears to be characterized by increased volatility and a struggle to maintain previous highs, suggesting that the market is consolidating gains rather than continuing the steep ascent.
The market may continue to consolidate or test lower support levels in the next 24 hours. Upside risk remains limited unless price reclaims $0.004973 with strong volume, while downside risk increases if the $0.004234 support level breaks, potentially leading to further corrections toward $0.004146.

Decoding market patterns and unlocking profitable trading strategies in the crypto space
Latest Articles
Stay ahead of the market.
Get curated U.S. market news, insights and key dates delivered to your inbox.


AInvest
PRO
AInvest
PRO




Comments
No comments yet