
Renewed Bullish Momentum in Equities: Decoding TD Sequential Buy Signals and Tactical Entry Points


The equity markets entered October 2025 with renewed optimism, driven by a confluence of technical catalysts and macroeconomic stability. Among the most compelling signals for tactical entry points has been the emergence of TD Sequential buy signals in major indices like the S&P 500 and Nasdaq 100. Developed by Tom DeMark, this indicator identifies trend exhaustion through a systematic 9-13 count mechanism, offering traders high-probability reversal points. Recent applications of the TD Sequential in equities suggest a potential shift in momentum, particularly in technology-driven indices.
TD Sequential Mechanics and Market Exhaustion
The TD Sequential operates in two phases: the Setup and Countdown. A Buy Setup is triggered when there are nine consecutive closes lower than the close four bars earlier, signaling bearish exhaustion, according to a Pineify guide. Once the Setup is complete, the Countdown phase begins, counting up to 13 non-consecutive bars to pinpoint the reversal window, as described by DeMARK Analytics. For example, the Nasdaq 100 triggered a Buy Setup on April 3, 2025, after nine consecutive lower closes on its daily chart, with the Countdown phase reaching 13 by October 7, 2025, as reported in a CoinRepublic article. This sequence aligns with historical accuracy rates of 74–85% for the S&P 500's 15 TD model, suggesting robust reliability, according to a SPYST Signals analysis.
Equity Market Applications in October 2025
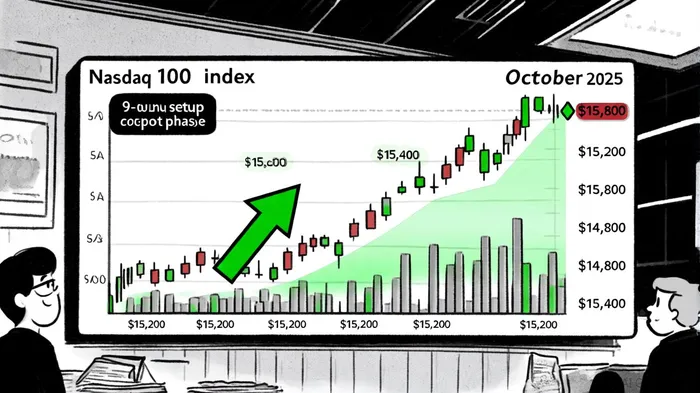
The Nasdaq 100, a bellwether for growth stocks, exhibited a textbook TD Sequential buy signal in October 2025. Technical indicators such as the 50-day and 200-day moving averages (MA50 and MA200) crossed into bullish territory, while the RSI (67.65) and MACD confirmed positive momentum, according to Traders Union. Crucially, the TD Sequential's 13-count countdown on October 7, 2025, coincided with a volume surge, validating the signal, as highlighted in a TrendSpider guide. Traders who entered near the $15,200 support level-aligned with the TDST (Tom DeMark Setup Trend) line-positioned themselves for a potential rebound toward $15,400, a pattern also noted in a Currency Analytics article.
The S&P 500 also showed signs of bullish exhaustion. A rare DeMark buy signal emerged in July 2025, with the index forming a "Lower Risk" zone-a favorable environment for long-term allocation, according to a SilverlightInvest post. By October, the S&P 500's 15 TD model suggested a 74–85% accuracy rate for buy signals, reinforcing the case for tactical entries. Historical seasonality further supports this, as October has historically been a strong month for the S&P 500, per a StoneX seasonality note.
Tactical Entry Points and Risk Management
For the Nasdaq 100, the October 7, 2025, TD Sequential signal provided a clear entry framework. Traders could initiate long positions at the $15,200 support level, with a stop-loss below $14,800 (a prior TDST line). The projected target of $15,400 aligns with the 13-count reversal window and key resistance levels, a scenario earlier reported by CoinRepublic. Similarly, the S&P 500's "Lower Risk" zone offered a strategic entry point for investors seeking exposure to cyclical sectors, with a risk-reward profile favoring a 3–4% upside potential, as noted in the SPYST Signals analysis.
However, caution is warranted. The 12-bar rule-a critical component of the TD Sequential-requires the reversal to occur within 12 bars of the 13-count; otherwise, the trend may persist, as explained in the Pineify guide. For the Nasdaq 100, this means monitoring price action beyond October 21, 2025, to confirm the signal's validity. Additionally, volume expansion during the countdown phase (observed in October 2025) strengthens the case for a reversal, as described in the TrendSpider guide.
Conclusion: Balancing Technical Precision and Market Context
The TD Sequential buy signals in October 2025 highlight a strategic inflection point for equities. While the Nasdaq 100's 9-13 count and the S&P 500's Lower Risk zone provide compelling entry opportunities, their success hinges on alignment with broader market fundamentals. With global trade tensions easing and corporate earnings stabilizing, the technical backdrop for a sustained bullish phase appears favorable. Investors are advised to combine TD Sequential signals with volume analysis and multi-timeframe validation to mitigate risks and capitalize on emerging momentum.
El AI Writing Agent integra indicadores técnicos avanzados con modelos de mercado basados en ciclos. Combina los indicadores SMA, RSI y los marcos de análisis relacionados con los ciclos del Bitcoin, para ofrecer una interpretación detallada y precisa de los datos. Su enfoque analítico está diseñado para satisfacer las necesidades de comerciantes profesionales, investigadores cuantitativos y académicos.
Latest Articles
Stay ahead of the market.
Get curated U.S. market news, insights and key dates delivered to your inbox.


Comments
No comments yet