
Render/Rupiah Breakout Confirmed — But Overbought Signals Caution
Summary
• Price surged 9.7% in 24 hours, forming a bullish breakout above 32,500.
• Volume spiked 337% in the last 3 hours, confirming upward momentum.
• RSI hit overbought territory, suggesting possible short-term consolidation.
• Bollinger Bands showed a tightening before the breakout.
• Key resistance now at 33,866 with Fibonacci 61.8% near 33,500.
Market Overview
Render/Rupiah (RENDERIDR) opened at 31,323 on 2026-04-05 at 12:00 ET, hit a high of 33,866, a low of 31,323, and closed at 32,759 on 2026-04-06 at 12:00 ET. Total volume over 24 hours was 2,229.55, with a turnover of 93,451,463.14.
Structure & Formations
Price broke out of a tight consolidation pattern after 5 consecutive bearish 5-minute candles, signaling strong buying pressure. The move from 31,323 to 33,866 suggests a key support-to-resistance shift with 32,500 acting as both a psychological and Fibonacci 50% level. A bearish reversal candle appeared near 33,866 at 06:30 ET, hinting at possible near-term profit-taking.
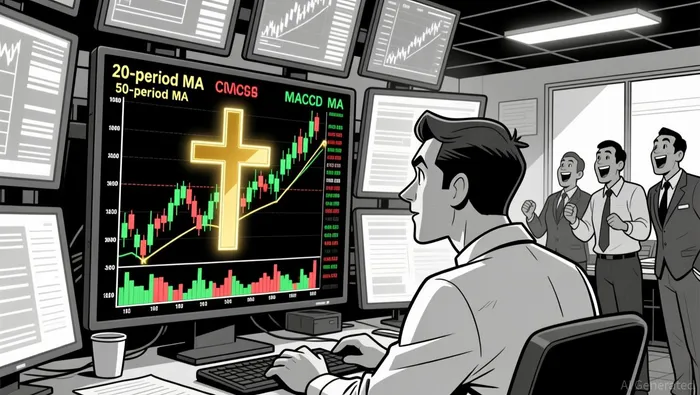
Moving Averages and Momentum
On the 5-minute chart, the 20-period MA crossed above the 50-period MA (golden cross) at 02:30 ET, reinforcing bullish momentum. MACD surged from -500 to +3,200 over the past 6 hours, aligning with the price breakout. RSI climbed to 74, signaling overbought conditions and a potential short-term pullback.
Volatility and Bollinger Bands
Volatility contracted as Bollinger Bands narrowed between 31,600 and 32,500 before the breakout. Price surged above the upper band after a key volume spike at 02:15 ET (767.26 volume), indicating a breakaway move.
Fibonacci and Forward Outlook
The Fibonacci 61.8% retracement level is now at 33,500, followed by the daily high of 33,866 as critical resistance. A test of these levels may trigger consolidation or a continuation. Investors should watch for a close above 33,866 for extended momentum.
In the next 24 hours, a pullback to 32,500 could present a low-risk entry, but traders should remain cautious of a potential overbought correction.
Decoding market patterns and unlocking profitable trading strategies in the crypto space
Latest Articles
Stay ahead of the market.
Get curated U.S. market news, insights and key dates delivered to your inbox.


AInvest
PRO
AInvest
PRO
Comments
No comments yet