
REDUSDT Rebounds From Rejection as Sellers Absorb Volume
 Aime Summary
Summary
- REDUSDT trades near $0.1114 after rejecting $0.1185 resistance.
- Volume spikes triggered sharp reversals, indicating strong seller absorption.
- Market structure shows higher highs but recent price action is weakening.
- Key support at $0.1109 is critical for maintaining current levels.
- Upside risks persist if $0.1185 is reclaimed with sustained volume.
Market Overview
RedStone/Tether (REDUSDT) closed the latest hour at $0.1114. The 24-hour total volume was approximately 518,000 USDT, reflecting moderate trading activity against a backdrop of recent volatility.
1-Hour Support/Resistance and Candlestick Patterns
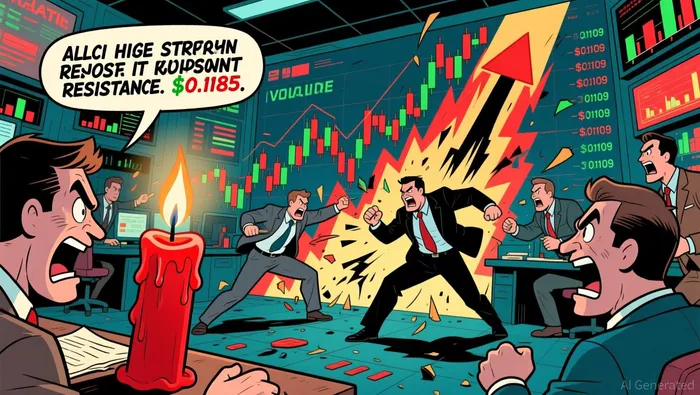
Price action has established immediate resistance around $0.1185, where a significant volume spike at 00:00 on August 23 failed to sustain upward momentum, resulting in a long upper shadow. This rejection was followed by another failed attempt near $0.1174 earlier in the session. On the downside, $0.1109 has emerged as a critical support level, tested multiple times with long lower shadows appearing at 03:00 and 05:00, suggesting buyers are stepping in at these lows. The market structure indicates a higher high trend over the longer term, but the current price is closer to immediate support than resistance. Candlestick patterns reveal repeated long upper shadow formations, particularly at 00:00 and 01:00, signaling strong selling pressure at higher prices. While bullish engulfing patterns appeared briefly, they were quickly countered by doji and rejection candles, indicating indecision and potential exhaustion in the buying phase.
Volume and Turnover vs. Historical Comparison
The 24-hour total volume of approximately 518,000 USDT is significantly lower than the 7-day average daily volume of 1,069,394 USDT and the 15-day average of 594,878 USDT. This suggests that current trading interest is subdued compared to recent weeks. However, specific hourly spikes deviated sharply from the 7-day average hourly volume of 44,558 USDT. The hour at 00:00 on August 23 saw a volume of 77,775 USDT, nearly double the hourly average, yet price only moved from $0.1158 to $0.1160 before reversing. Similarly, the 01:00 hour recorded 72,970 USDT in volume with a high of $0.1205, but price closed lower at $0.1169. These instances of high volume with no follow-through suggest that selling pressure absorbed the buying interest effectively, preventing sustained upward movement. The volume anomalies did not drive price effectively higher, indicating that sellers are in control at these elevated levels.
Look Back: Current Market Phase
The 15-day daily price range is 0.06, and the market structure feature is identified as higher high, which typically suggests an uptrend. However, the recent 3-day price change is -13.24%, while the 7-day change is +25.88%. This sharp reversal after a significant prior move suggests the market is currently in a mean reversion phase. The price is correcting from its recent highs, testing lower support levels after a strong weekly gain. The current price action of rejecting higher levels and finding support at lower ones aligns with a consolidation or pullback within a broader uptrend, rather than a complete trend reversal. Traders should monitor if the price can stabilize above key support to resume the higher high structure.
If $0.1185 is broken with strong volume, upside risk extends toward $0.1205. Conversely, a break below $0.1109 could trigger downside risk toward $0.1084.

Decoding market patterns and unlocking profitable trading strategies in the crypto space
Latest Articles
Stay ahead of the market.
Get curated U.S. market news, insights and key dates delivered to your inbox.


AInvest
PRO
AInvest
PRO




Comments
No comments yet