
Red Violet (RDVT) Loses 19% in 4 Weeks, Here's Why a Trend Reversal May be Around the Corner
Red Violet, Inc. (RDVT) has been beaten down lately with too much selling pressure. While the stock has lost 19.1% over the past four weeks, there is light at the end of the tunnel as it is now in oversold territory and Wall Street analysts expect the company to report better earnings than they predicted earlier.
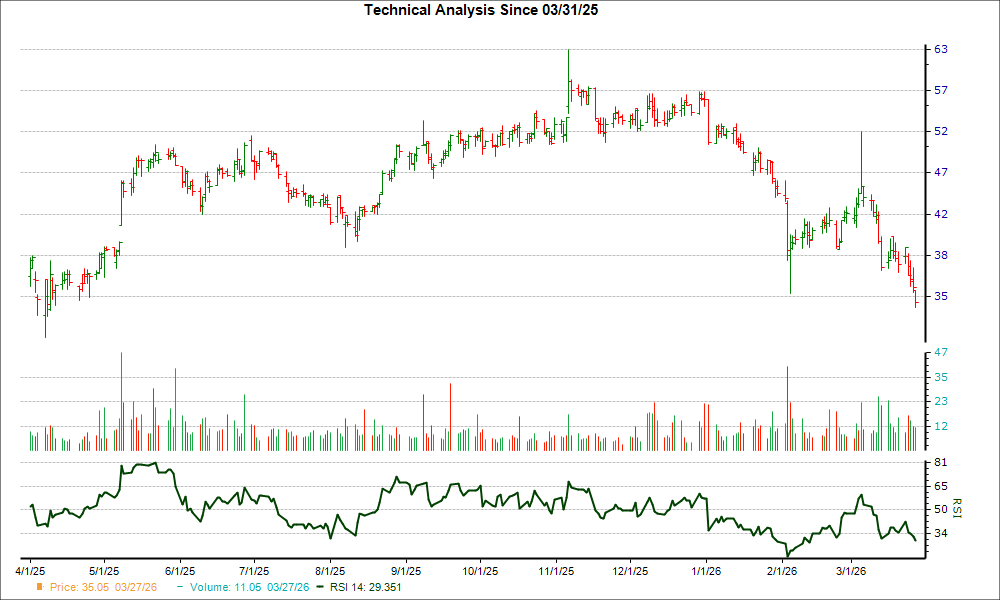
We use Relative Strength Index (RSI), one of the most commonly used technical indicators, for spotting whether a stock is oversold. This is a momentum oscillator that measures the speed and change of price movements.
RSI oscillates between zero and 100. Usually, a stock is considered oversold when its RSI reading falls below 30.
Technically, every stock oscillates between being overbought and oversold irrespective of the quality of their fundamentals. And the beauty of RSI is that it helps you quickly and easily check if a stock's price is reaching a point of reversal.
So, by this measure, if a stock has gotten too far below its fair value just because of unwarranted selling pressure, investors may start looking for entry opportunities in the stock for benefiting from the inevitable rebound.
However, like every investing tool, RSI has its limitations, and should not be used alone for making an investment decision.
Why RDVTRDVT-- Could Bounce Back Before Long
The RSI reading of 29.35 for RDVT is an indication that the heavy selling could be in the process of exhausting itself, so the stock could bounce back in a quest for reaching the old equilibrium of supply and demand.
The RSI value is not the only factor that indicates a potential turnaround for the stock in the near term. On the fundamental side, there has been strong agreement among the sell-side analysts covering the stock in raising earnings estimates for the current year. Over the last 30 days, the consensus EPS estimate for RDVT has increased 8.4%. And an upward trend in earnings estimate revisions usually translates into price appreciation in the near term.
Moreover, RDVT currently has a Zacks Rank #1 (Strong Buy), which means it is in the top 5% of more than 4,000 stocks that we rank based on trends in earnings estimate revisions and EPS surprises. This is a more conclusive indication of the stock's potential turnaround in the near term. You can see the complete list of today's Zacks Rank #1 (Strong Buy) stocks here >>>> .
Free Report: Profiting from the 2nd Wave of AI Explosion
The next phase of the AI explosion is poised to create significant wealth for investors, especially those who get in early. It will add literally trillion of dollars to the economy and revolutionize nearly every part of our lives.
Investors who bought shares like Nvidia at the right time have had a shot at huge gains.
But the rocket ride in the "first wave" of AI stocks may soon come to an end. The sharp upward trajectory of these stocks will begin to level off, leaving exponential growth to a new wave of cutting-edge companies.
Zacks' AI Boom 2.0: The Second Wave report reveals 4 under-the-radar companies that may soon be shining stars of AI’s next leap forward.
Access AI Boom 2.0 now, absolutely free >>Want the latest recommendations from Zacks Investment Research? Today, you can download 7 Best Stocks for the Next 30 Days. Click to get this free report
Red Violet, Inc. (RDVT): Free Stock Analysis Report
This article originally published on Zacks Investment Research (zacks.com).
Zacks is the leading investment research firm focusing on equities earnings estimates and stock analysis for the individual investor, including stock picks, stock screening, portfolio stock tracker and stock screeners. Copyright 2006-2026 Zacks Equity Research, Inc. editor@zacks.com (Manaing editor) webmaster@zacks.com (Webmaster)
Latest Articles
Stay ahead of the market.
Get curated U.S. market news, insights and key dates delivered to your inbox.


AInvest
PRO
AInvest
PRO
Comments
No comments yet