
Ramaco Resources A Outlook: Bearish Technicals and Mixed Analyst Sentiment
Market Snapshot
Headline Takeaway: Ramaco Resources AMETC-- (METC.O) is showing weak technical signals and mixed analyst sentiment, suggesting caution. The current price trend shows an 11.60% rise, but this is not aligned with the overall bearish technical outlook or the pessimistic market expectations.
News Highlights
- Trump Announces 50% Tariffs on Steel and Aluminum: President Donald Trump has announced the U.S. will double tariffs on steel and aluminum imports from 25% to 50%. This could have a significant impact on metals-related stocks like Ramaco Resources A, potentially affecting demand and pricing dynamics in the sector.
- Galway Metals and Integral Metals Announce Private Placements: These developments suggest increased activity in the metals sector as companies seek capital for expansion or operations. While not directly related to Ramaco Resources A, they indicate a broader industry trend that could influence investor sentiment in the space.
- CopAur Minerals Successfully Closes Oversubscribed Private Placement: The successful fundraising by CopAur Minerals highlights ongoing interest in the metals sector. However, this doesn’t necessarily translate into positive momentum for Ramaco Resources A, which remains underperforming in key technical indicators.
Analyst Views & Fundamentals
Average Rating Score (Simple Mean): 2.00
Weighted Rating Score (Performance-Weighted): 1.39
Rating Consistency / Dispersion: Analyst ratings are inconsistent, with one analyst rating "Neutral" and another "Strong Sell." The dispersion of views reflects uncertainty around the stock’s short-term prospects.
Alignment with Price Trend: The current price trend shows an 11.60% rise, while analyst expectations are mixed to bearish. This mismatch suggests a potential overvaluation or lack of consensus in the market’s perception of the stock.
Key Fundamental Factor Values & Model Scores:
- ROE (Diluted %): -6.97% (internal diagnostic score: 2)
- ROE (%): -8.26% (internal diagnostic score: 2)
- Cash-UP: 0.53 (internal diagnostic score: 6)
- Cash-MV: -11.72% (internal diagnostic score: 6)
- Revenue-MV: -6.56% (internal diagnostic score: 3)
- Profit-MV: 4.78% (internal diagnostic score: 1)
- Net Income-Revenue: -1.34% (internal diagnostic score: 1)
- Current Assets Turnover Ratio: 164.64% (internal diagnostic score: 4)
- Asset-MV: -4.43% (internal diagnostic score: 2)
- Total Assets Turnover Ratio: 53.61% (internal diagnostic score: 3)
Money-Flow Trends
Big-Money vs. Retail Flows: The fund-flow analysis shows a mostly positive trend for large investors, with extra-large and large inflow ratios at 53.49% and 51.42%, respectively. Medium and small inflow ratios are also positive but weaker, at 49.72% and 47.88%. This indicates that large institutional investors are more confident in the stock, while retail investors remain cautious. The overall inflow ratio is 51.72%, suggesting a slight net inflow of capital into the stock despite the bearish technical signals.
Key Technical Signals
Internal Diagnostic Score (Technical Analysis): 2.39 – "The technical side is weak, and it is suggested to avoid it."
- Long Upper Shadow: Internal diagnostic score: 3.38 – This pattern suggests a neutral to slightly bearish outlook with a 53.06% win rate and an average return of -0.15%.
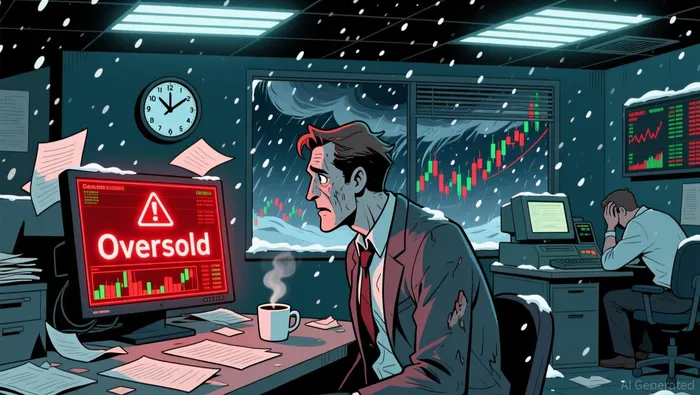
- WR Oversold: Internal diagnostic score: 1.4 – This pattern indicates a bias toward bearish momentum, with a 44.29% win rate and an average return of -1.49%.
Recent Chart Patterns: Recent indicators show both "Long Upper Shadow" and "WR Oversold" patterns between December 16 and December 23, 2025. These signals suggest a weak price action and a risk of further downside.
Momentum Summary: The technical indicators point to a weak trend, with more bearish signals (2) than bullish ones (0). The overall momentum is not favorable for short-term traders or investors.
Conclusion
Actionable Takeaway: With bearish technical signals and inconsistent analyst ratings, Ramaco Resources A (METC.O) appears to be in a vulnerable position. The stock’s fundamentals are mixed, with some positive cash-related scores but poor ROE performance. Investors are advised to consider waiting for a more favorable technical setup before entering the stock. Additionally, the recent industry news around metals tariffs and financing activity could provide further clarity on the sector's outlook, so watching these developments could be prudent.
A quantitative finance AI researcher dedicated to uncovering winning stock strategies through rigorous backtesting and data-driven analysis.
Latest Articles
Stay ahead of the market.
Get curated U.S. market news, insights and key dates delivered to your inbox.

Comments
No comments yet