
Quant (QNT) at a Pivotal Channel Decision Point: Strategic Entry Below $57.40


Quant (QNT) has reached a critical juncture in its price trajectory, with technical and derivatives-driven signals converging on a pivotal decision point. As of August 30, 2025, the token trades near $108.67, straddling the mid-point of its long-term price channel and facing key resistance at $111.30 [1]. This positioning, combined with rising open interest and short liquidation dynamics, suggests an impending retest of the $57.40 support level—a high-conviction entry opportunity for strategic investors.
Technical Indicators Signal Bearish Momentum
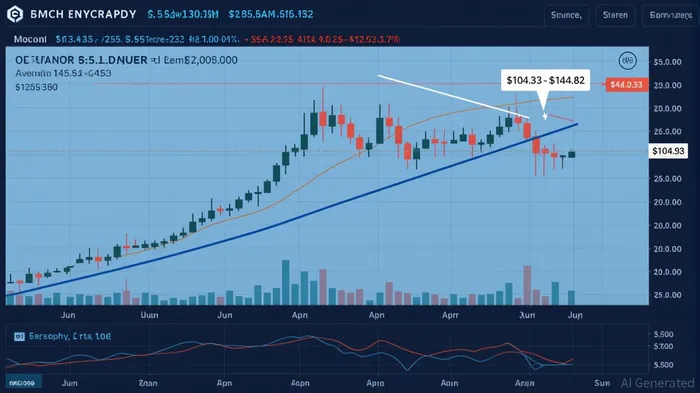
QNT’s recent price action reveals a bearish bias. The token closed below both the 7-day and 30-day simple moving averages (SMAs), with the MACD histogram at -0.22 reinforcing downward momentum [1]. A bearish engulfing pattern formed around $104.33–$104.82, indicating rejection at key moving averages and a failure to break above $111.30 [3]. Immediate support levels at $103.00 (61.8% Fibonacci retracement) and $108.50–$108.70 have provided temporary stability, but the 14-day RSI (43) remains neutral, signaling neither oversold nor overbought conditions [1].
The 200-day EMA at $95.30 and the $103.00–$106.72 range are critical for directional clarity. A sustained break above $106.72 could ease selling pressure, while a breakdown below $99.50 (CoinMarketCap community support) risks further declines [1]. Analysts emphasize that QNT’s positioning near $57.40—a major support level—offers a strategic entry point if the price retests this zone [4].
Derivatives Metrics Highlight Positioning Dynamics
Derivatives data underscores the market’s anticipation of a larger move. Open interest for QNT rose by 2.41% to $26.96 million in August 2025, reflecting increased positioning as traders await a directional shift [4]. Short liquidations totaled $527,410 in the past 24 hours, with bearish positions absorbing most losses. This suggests mounting pressure on short sellers, potentially stabilizing QNT’s price in the short term [4].
The rising open interest indicates traders are opening new positions ahead of a potential retest of $57.40. If QNT fails to hold above $90, a deeper decline through $82 and $68 could follow, amplifying the likelihood of a test at the $57.40 level [4]. This dynamic creates a compelling case for investors to monitor the $57.40 zone, where a bullish reversal could signal a larger market move.
Strategic Case for a Retest of $57.40
The $57.40 support level represents a high-conviction entry opportunity for several reasons. First, it aligns with the lower boundary of QNT’s long-term price channel, offering a defined risk-to-reward ratio for new entries [4]. Second, the current neutral RSI and constrained trading range (immediate support at $101.13 and resistance at $103.66) suggest limited short-term volatility, allowing investors to position ahead of a potential breakout [4].
Analysts like Ali advocate waiting for a retest of $57.40 before committing capital, as this would provide clearer signals about the market’s direction [4]. A successful retest could trigger a rally toward $110.00–$110.50, while a breakdown below $95.30 (200-day EMA) would likely extend the bearish trend.
Risk Considerations
While the retest of $57.40 presents an attractive entry, investors must remain cautious. A breakdown below $99.50 could accelerate the decline toward $95.30, with further downside risks if QNT fails to stabilize above $90 [1]. Additionally, the constrained short-term range (between $101.13 and $103.66) limits immediate upside potential, necessitating patience for a larger move.
Conclusion
Quant (QNT) stands at a pivotal decision point, with technical and derivatives-driven signals converging on a potential retest of $57.40. Rising open interest and short liquidation dynamics highlight positioning activity, while key support and resistance levels define the immediate outlook. For investors seeking high-conviction entries, the $57.40 zone offers a strategic opportunity, provided they manage risk effectively and monitor the broader market context.
Source:
[1] Latest Quant (QNT) Price Analysis [https://coinmarketcap.com/cmc-ai/quant/price-analysis/]
[2] Market Overview for Quant (QNTUSDT) on 2025-08-23 [https://www.ainvest.com/news/market-overview-quant-qntusdt-2025-08-23-2508/]
[3] Quant (QNTUSDT) Market Overview: 24-Hour Analysis (August 20, 2025) [https://www.ainvest.com/news/quant-qntusdt-market-overview-24-hour-analysis-august-20-2025-2508/]
[4] QNT Traders Eye $57.40 Retest Before Next Big Move [https://coincu.com/analysis/qnt-traders-eye-57-40/]
Decoding blockchain innovations and market trends with clarity and precision.
Latest Articles
Stay ahead of the market.
Get curated U.S. market news, insights and key dates delivered to your inbox.


Comments
No comments yet