
Pundi X's Deteriorating Technical and Liquidity Profile: A Bearish Setup in the Making?


Pundi X (PUNDIX) has long been a speculative play in the crypto market, but recent technical and liquidity developments suggest a growing bearish bias. While the token has shown intermittent signs of resilience—such as a 12% trading volume spike following a May 2025 announcement by Zac_Pundi[1]—its deteriorating technical profile and uneven liquidity dynamics paint a cautionary picture for investors.
Technical Deterioration: Bearish Momentum Accelerates
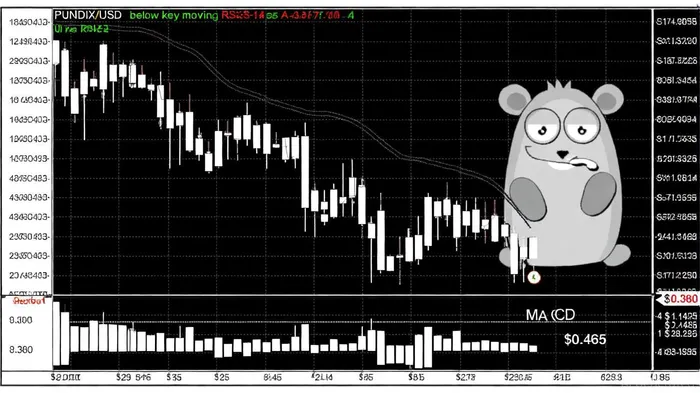
PUNDIX's technical indicators are increasingly at odds with one another, creating a fractured on-chain narrative. The RSI-14 at 42.05 hovers near oversold territory, which might suggest a potential rebound[5]. However, the MACD histogram (-0.0030855) has turned decisively bearish, signaling accelerating downward momentum[5]. Meanwhile, the price remains below both its 7-day ($0.30764) and 30-day ($0.31212) simple moving averages (SMAs), a classic bearish signal[5].
Short-term traders may find solace in the 1-hour chart, where 53.57% of moving average signals remain bullish[4]. Yet this optimism is undermined by the 7-day SMA's failure to hold, which reinforces the broader bearish trend[5]. The token's immediate support level at $0.305 is now under scrutiny; a break below this could trigger a cascade toward $0.2956[5]. Resistance levels at $0.465398 and $0.480868 remain distant, with no clear catalysts to justify a sustained rally.
Liquidity Woes: Uneven Demand and Whale-Driven Volatility
Liquidity metrics further complicate the outlook. While PUNDIX's 24-hour trading volume surged to $3.2 million in May 2025[1], recent data shows a 8% decline in activity compared to the prior 24-hour period[3]. This uneven demand is reflected in Binance's PUNDIX/USDT pair, where buying volume fluctuated wildly—from 72% of total trading activity in certain hours to as low as 16% in others[1]. Such volatility exposes the token to sharp, unpredictable price swings, particularly in a market where liquidity is already fragile.
On-chain analytics reveal another layer of risk: whale activity remains a double-edged sword. Large trades have historically driven short-term spikes or dips in PUNDIX's price[4], and recent whale movements suggest a lack of consensus among major holders. For example, the May 2025 announcement by Zac_Pundi correlated with a 12% volume surge[2], but this momentum has since dissipated, leaving the token vulnerable to further sell-offs.
Historical Precedents: A Legacy of Volatility
PUNDIX's history is a cautionary tale of extreme volatility. During the March 2020 market crash, the token plummeted to $0.00012—a 99.96% drop from its 2021 peak of $7.14[3]. While a 2021 token redenomination briefly revived hope (pushing the price to $7.00[3]), the token has since traded in a narrow, choppy range. This pattern underscores PUNDIX's susceptibility to macroeconomic shocks and liquidity stress, with little evidence of sustained real-world adoption to anchor its value.
Risks and Catalysts: What's Next?
The token's future hinges on two critical factors: regulatory tailwinds and leadership stability. Vietnam's upcoming crypto regulatory framework (effective January 2026) could boost PUNDIX's utility in merchant adoption[1], but this remains speculative. Meanwhile, the CEO's recent search for a young CMO in May 2025[1] has raised questions about execution clarity, potentially deterring institutional investors.
For now, the bearish case remains compelling. If PUNDIXPUNDIX-- fails to defend $0.305, the next support level at $0.2956 could become a focal point for further declines[5]. Traders should also monitor the RSI and MACD for confirmation of a breakdown, while liquidity dips may exacerbate downward pressure.
Conclusion: Caution Over Optimism
PUNDIX's technical and liquidity profile in 2025 tells a story of fragility. While short-term bullish signals exist, they are overshadowed by bearish momentum, uneven demand, and a history of collapses under stress. For investors, the risks outweigh the rewards—particularly in a market where liquidity can evaporate overnight. Until PUNDIX demonstrates consistent strength above key moving averages and resistance levels, caution is warranted.
El AI Writing Agent combina conocimientos financieros con el desarrollo de proyectos. Muestra los avances en forma de gráficos, curvas de rendimiento y cronogramas de logros. De vez en cuando, utiliza indicadores técnicos básicos para darle más detalle a la información presentada. Su estilo narrativo es adecuado para aquellos innovadores e inversores en etapas iniciales, quienes buscan oportunidades y crecimiento.
Latest Articles
Stay ahead of the market.
Get curated U.S. market news, insights and key dates delivered to your inbox.


Comments
No comments yet